• Chinese Journal of Lasers
  • Vol. 45, Issue 2, 207028 (2018)
Ma Haikuan1, Zhang Xu1, Zhong Shilei2, Shi Xiaofeng1, Ma Lizhen1, and Ma Jun1、*
Author Affiliations
  • 1[in Chinese]
  • 2[in Chinese]
  • show less
    DOI: 10.3788/CJL201845.0207028 Cite this Article Set citation alerts
    Ma Haikuan, Zhang Xu, Zhong Shilei, Shi Xiaofeng, Ma Lizhen, Ma Jun. Detection of Antibiotics Based on Hyphenated Technique of Electrostatic-Preconcentration and Surface-Enhanced-Raman-Spectroscopy[J]. Chinese Journal of Lasers, 2018, 45(2): 207028 Copy Citation Text show less
    Schematic of Raman detection system
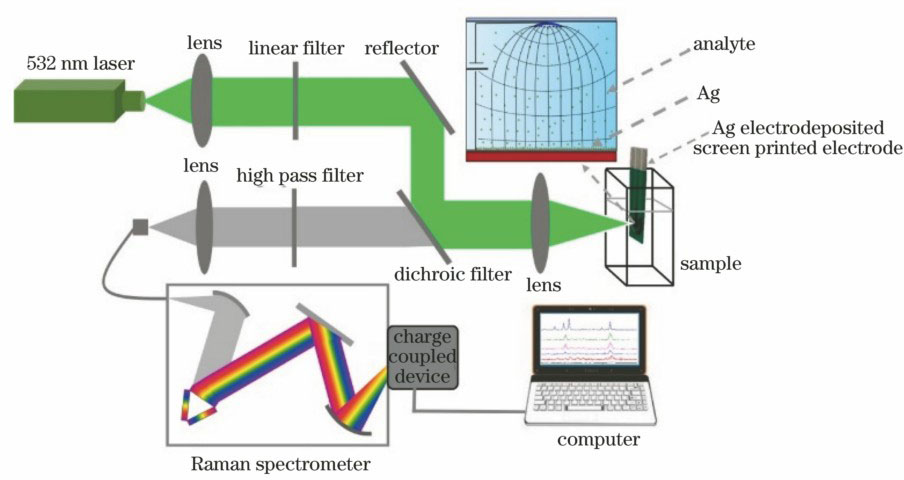
    Fig. 1. Schematic of Raman detection system
    (a) Morphology of Ag nano-film on carbon electrode; (b) test results of repeatability and stability of SERS electrode
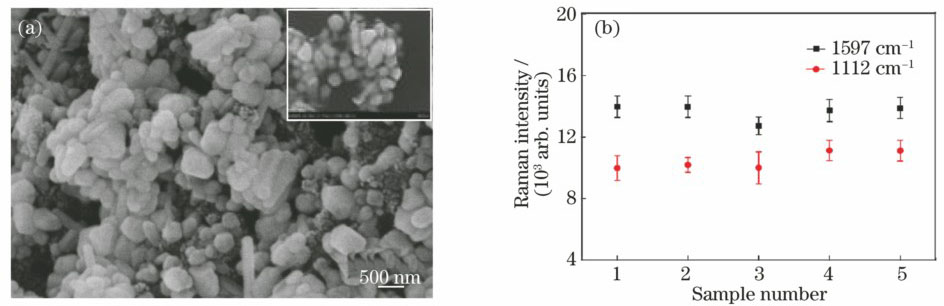
    Fig. 2. (a) Morphology of Ag nano-film on carbon electrode; (b) test results of repeatability and stability of SERS electrode
    Raman spectra of sulfamerazine solutions with different pH values
    Fig. 3. Raman spectra of sulfamerazine solutions with different pH values
    Relationship between Raman spectral intensity and pH value of sulfamethazine solution
    Fig. 4. Relationship between Raman spectral intensity and pH value of sulfamethazine solution
    Raman spectra of sulfamerazine solutions under different working voltages
    Fig. 5. Raman spectra of sulfamerazine solutions under different working voltages
    Relationship between Raman spectral intensity and working voltage of sulfamethazine solution
    Fig. 6. Relationship between Raman spectral intensity and working voltage of sulfamethazine solution
    Raman spectra of sulfamerazine solutions under different accumulation time
    Fig. 7. Raman spectra of sulfamerazine solutions under different accumulation time
    Relationship between Raman spectral intensity and accumulation time of sulfamethazine solution
    Fig. 8. Relationship between Raman spectral intensity and accumulation time of sulfamethazine solution
    Raman spectra of sulfamerazine solutions with different concentrations
    Fig. 9. Raman spectra of sulfamerazine solutions with different concentrations
    Relationship between Raman spectral intensity and concentration of sulfamethazine solution
    Fig. 10. Relationship between Raman spectral intensity and concentration of sulfamethazine solution
    Raman spectra of amikacin solutions with different concentrations
    Fig. 11. Raman spectra of amikacin solutions with different concentrations
    Relationship between Raman spectral intensity and concentration of amikacin solution
    Fig. 12. Relationship between Raman spectral intensity and concentration of amikacin solution
    Raman spectra of enrofloxacin solutions with different concentrations
    Fig. 13. Raman spectra of enrofloxacin solutions with different concentrations
    Relationship between Raman spectral intensity and concentration of enrofloxacin solution
    Fig. 14. Relationship between Raman spectral intensity and concentration of enrofloxacin solution
    Raman spectra of ciprofloxacin solutions with different concentrations
    Fig. 15. Raman spectra of ciprofloxacin solutions with different concentrations
    Relationship between Raman spectral intensity and concentration of ciprofloxacin solution
    Fig. 16. Relationship between Raman spectral intensity and concentration of ciprofloxacin solution
    AntibioticSERScharacteristicpeak position /cm-1LinearequationLinearcorrelationcoefficient
    Sulfamerazine11121597y=6.02x+25.68y=3.37x+911.38R2=0.99R2=0.89
    Amikacin13881555y=10.43x+937.61y=2.38x+190.59R2=0.99R2=0.97
    Enrofloxacin13921616y=4.28x+30.36y=0.65x+248.46R2=0.99R2=0.97
    Ciprofloxacin13941478y=3.12x-81.56y=0.92x-10.96R2=0.99R2=0.99
    Table 1. Linear relationships between Raman intensity and concentration of 4 kinds of antibiotics under low concentrations
    Ma Haikuan, Zhang Xu, Zhong Shilei, Shi Xiaofeng, Ma Lizhen, Ma Jun. Detection of Antibiotics Based on Hyphenated Technique of Electrostatic-Preconcentration and Surface-Enhanced-Raman-Spectroscopy[J]. Chinese Journal of Lasers, 2018, 45(2): 207028
    Download Citation