• Spectroscopy and Spectral Analysis
  • Vol. 42, Issue 6, 1781 (2022)
Yan-fang PENG1、*, Jun WANG1、1;, Zhi-sheng WU2、2; *;, Xiao-na LIU3、3;, and Yan-jiang QIAO2、2; *;
Author Affiliations
  • 11. Pharmacy Faculty, Hubei University of Chinese Medicine, Wuhan 430065, China
  • 22. School of Chinese Materia, Beijing University of Chinese Medicine, Beijing 100029, China
  • 33. College of Integrated Traditional Chinese Medicine and Wastern Medicine, Binzhou Medical University, Yantai 264003, China
  • show less
    DOI: 10.3964/j.issn.1000-0593(2022)06-1781-05 Cite this Article
    Yan-fang PENG, Jun WANG, Zhi-sheng WU, Xiao-na LIU, Yan-jiang QIAO. NIR Band Assignment of Tanshinone ⅡA and Cryptotanshinone by 2D-COS Technology and Model Application Tanshinone Extract[J]. Spectroscopy and Spectral Analysis, 2022, 42(6): 1781 Copy Citation Text show less
    Original NIR spectra of deuterated chloroform, Tanshinone ⅡA and Cryptotanshinone solutions
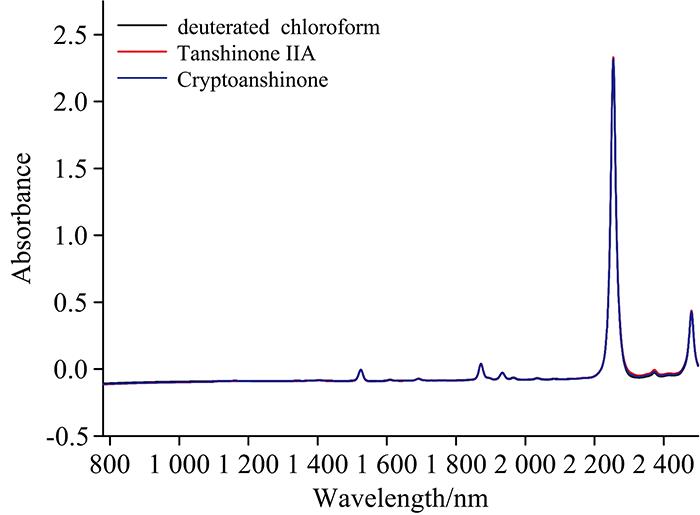
    Fig. 1. Original NIR spectra of deuterated chloroform, Tanshinone ⅡA and Cryptotanshinone solutions
    Two-dimensional synchronous slice spectra of deuterated chloroform, Tanshinone ⅡA and Cryptotanshinone (a) and partialenlargeddetail of slice spectra (b)
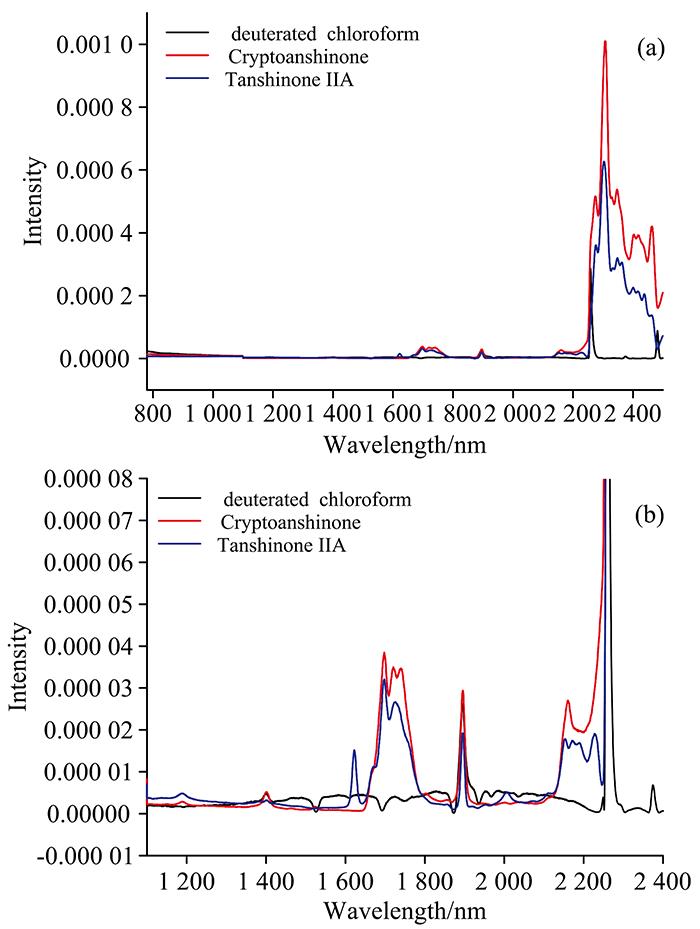
    Fig. 2. Two-dimensional synchronous slice spectra of deuterated chloroform, Tanshinone ⅡA and Cryptotanshinone (a) and partialenlargeddetail of slice spectra (b)
    Chemical structure of Tanshinone ⅡA and Cryptotanshinone
    Fig. 3. Chemical structure of Tanshinone ⅡA and Cryptotanshinone
    Original NIR spectra of Tanshinone Extract
    Fig. 4. Original NIR spectra of Tanshinone Extract
    Selection bands of SiPLS(a): Tanshinone ⅡA; (b): Cryptotanshinone
    Fig. 5. Selection bands of SiPLS
    (a): Tanshinone ⅡA; (b): Cryptotanshinone
    取样浓度/(mg·mL-1)
    丹参酮ⅡA-3.565.158.3310.0511.5513.47
    隐丹参酮2.273.775.178.519.9711.5413.23
    Table 1. Concentration distribution of deuterated chloroform solution of tanshinone ⅡA and cryptotanshinone
    Latent
    factor
    Rcal2RMSECRMSECVRpre2RMSEP
    隐丹参酮
    raw80.974 00.003 30.005 40.930 80.002 9
    baseline80.975 70.003 20.005 30.949 00.002 5
    normalize70.981 90.002 80.004 10.973 80.001 8
    SG80.974 00.003 30.005 40.873 70.004 0
    SG 1st40.965 30.003 90.005 00.942 90.002 7
    SG 2nd30.980 30.002 90.005 20.902 70.003 5
    SNV70.980 60.002 90.004 60.956 50.002 3
    丹参酮ⅡA
    raw80.961 20.005 90.010 50.651 50.006 6
    baseline100.983 30.003 80.009 50.797 80.005 1
    normalize80.986 00.003 50.006 90.796 10.005 1
    SG80.961 10.005 90.010 40.649 50.006 7
    SG 1st80.992 90.002 50.005 30.969 30.002 0
    SG 2nd40.985 90.003 50.005 50.969 80.002 0
    SNV70.982 90.389 60.005 40.917 10.003 2
    Table 2. Results of Tanshinone IIA and Cryptotanshinone PLS models based on different pretreatment methods (g·g-1)
    Latent
    factors
    Calibration setValidation set
    R2RMSECRMSECVR2RMSEP
    丹参酮ⅡA
    SiPLS(4, 9, 10)100.990 00.002 20.004 60.925 30.003 1
    1 600~1 800, 1 900~2 230, 2 300~2 40090.970 00.005 10.010 90.835 20.004 6
    1 600~1 800100.990 30.002 90.005 10.990 60.001 1
    1 900~2 23080.975 00.004 70.007 80.907 30.003 4
    2 300~2 40060.980 60.004 10.007 00.738 90.005 7
    隐丹参酮
    SiPLS(1, 4, 9)80.990 90.002 00.003 20.971 00.001 9
    1 600~1 800, 1 900~2 230, 2 300~2 40060.983 40.002 70.003 90.969 50.001 9
    1 600~1 80050.975 00.003 30.004 70.903 60.003 5
    1 900~2 23090.991 00.002 00.005 80.883 00.003 8
    2 300~2 40060.987 00.002 40.003 90.957 80.002 3
    Table 3. PLS model results of different band screening methods (g·g-1)
    Yan-fang PENG, Jun WANG, Zhi-sheng WU, Xiao-na LIU, Yan-jiang QIAO. NIR Band Assignment of Tanshinone ⅡA and Cryptotanshinone by 2D-COS Technology and Model Application Tanshinone Extract[J]. Spectroscopy and Spectral Analysis, 2022, 42(6): 1781
    Download Citation