
Xin-qiang WANG, Feng HU, Wei XIONG, Song YE, Shu LI, Yong-ying GAN, Shan YIN, Fang-yuan WANG. Research on Raman Signal Processing Method Based on Spatial Heterodyne[J]. Spectroscopy and Spectral Analysis, 2022, 42(1): 93
- Spectroscopy and Spectral Analysis
- Vol. 42, Issue 1, 93 (2022)
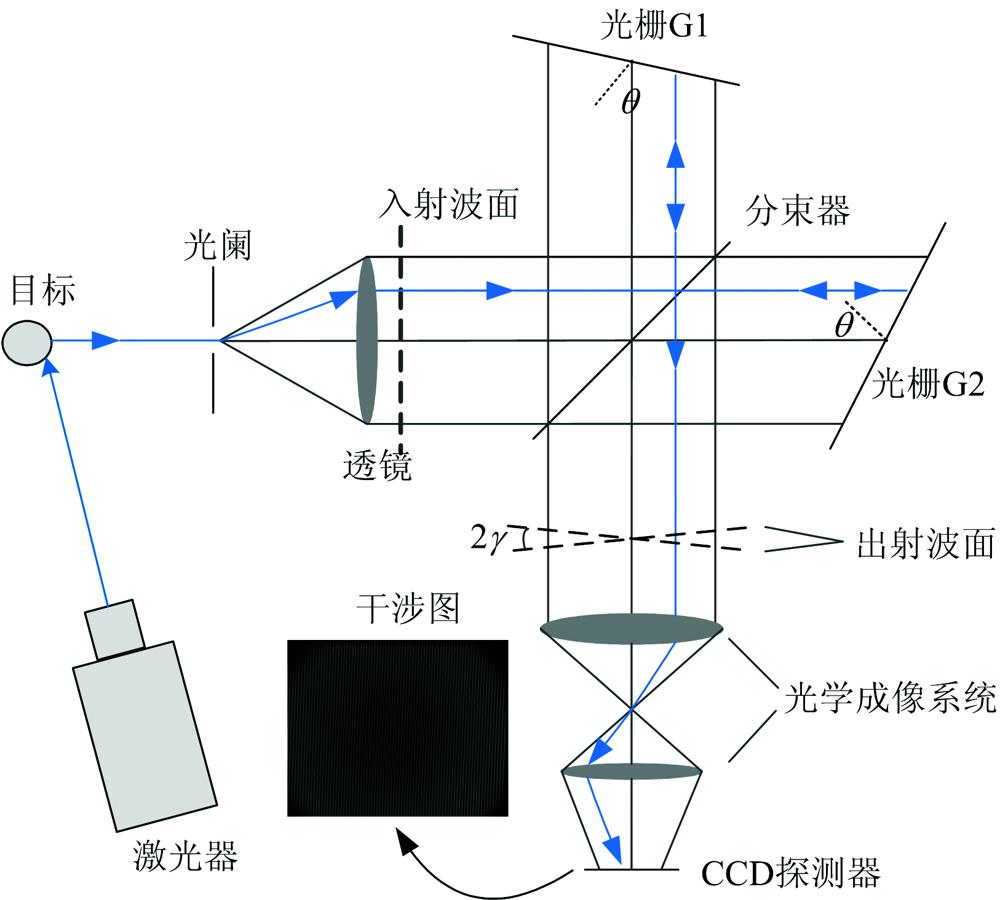
Fig. 1. Schematic diagram of SHRS detection
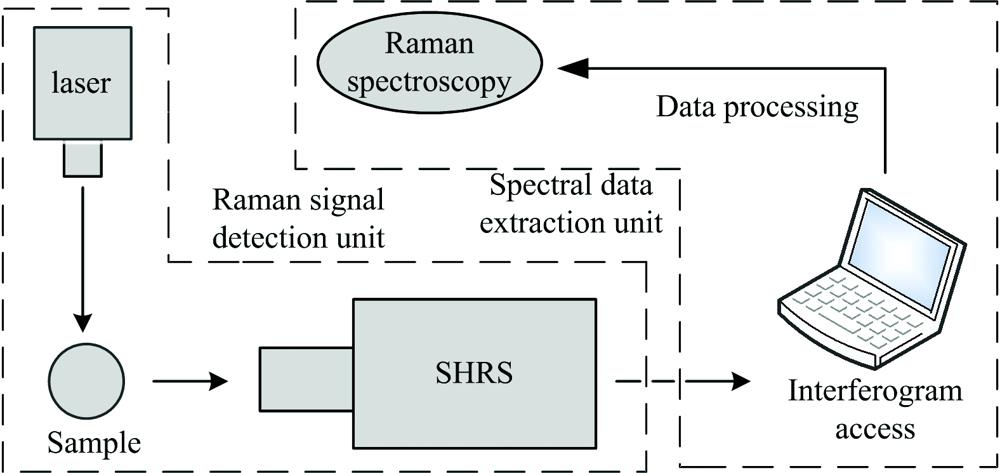
Fig. 2. Structure diagram of the detection system for rapid and direct detection of material Raman spectra
Fig. 3. Experimental detection system diagram
Fig. 4. SHRS interferogram processing and restoration spectra
(a): Clover 2D interferogram; (b): Row average interferogram;(c): Fourier transform spectrum of the mean interferogram; (d): Fourier transform spectrum of each row;(e): Row spectral mean; (f): 2D spectrogram; (g): The center row corresponds to the spectrum
(a): Clover 2D interferogram; (b): Row average interferogram;(c): Fourier transform spectrum of the mean interferogram; (d): Fourier transform spectrum of each row;(e): Row spectral mean; (f): 2D spectrogram; (g): The center row corresponds to the spectrum
Fig. 5. 2D spectrogram of Sylvite
Fig. 6. Resampling the fitted line with 2D spectrogram
Fig. 7. Comparison of Raman spectra of clover obtained by three methods
(a): Row by row Fourier transforms add and average; (b): The center row of 2D spectrogram corresponds to the spectrum; (c): The corresponding spectrum of the line is resampled in 2D spectrogram
(a): Row by row Fourier transforms add and average; (b): The center row of 2D spectrogram corresponds to the spectrum; (c): The corresponding spectrum of the line is resampled in 2D spectrogram

Set citation alerts for the article
Please enter your email address
© Copyright 2018-2021 | Chinese Laser Press. All Rights Reserved 沪ICP备15018463号-20