
Fangfang Xue, Yueming Wang, Qi Li. Recognition of Cattle Daily Behavior Based on Spatial Relationship of Feature Parts[J]. Laser & Optoelectronics Progress, 2021, 58(22): 2215007
- Laser & Optoelectronics Progress
- Vol. 58, Issue 22, 2215007 (2021)
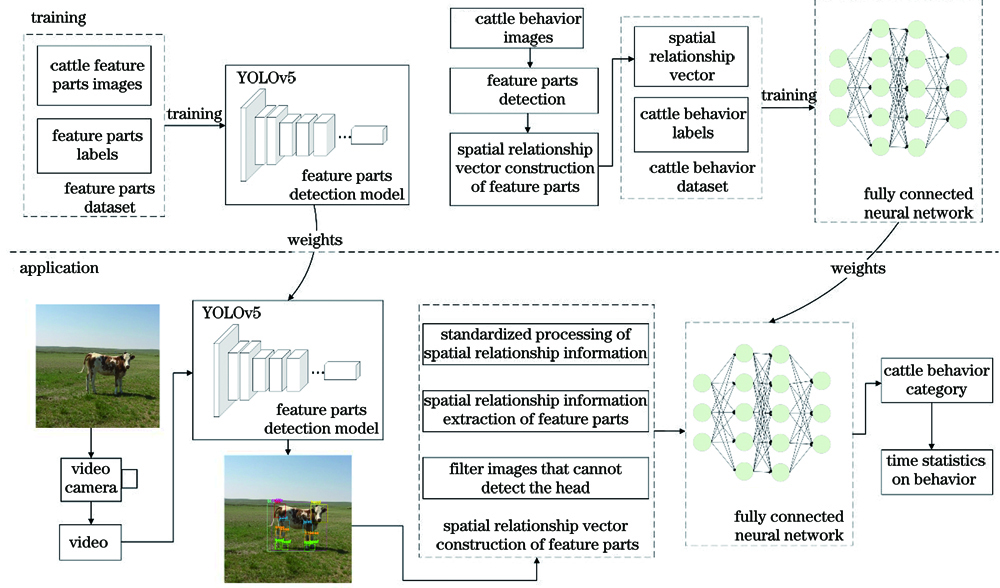
Fig. 1. Schematic diagram of the technical solution
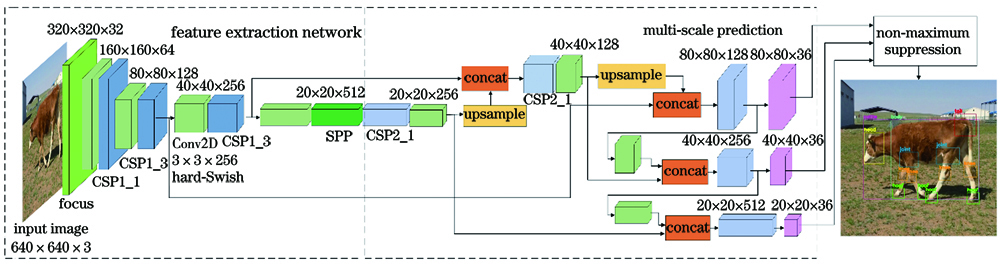
Fig. 2. Structure diagram of the YOLOv5s model
Fig. 3. Schematic diagram of the angle between feature parts
Fig. 4. Structure of the fully connected neural network
Fig. 5. Labeling of feature parts
Fig. 6. Training results of the YOLOv5s model. (a) Loss curve; (b) precision; (c) recall; (d) mAP
Fig. 7. Detection results of cattle feature parts
Fig. 8. Sample image of the cattle behavior. (a) Standing behavior; (b) lying behavior; (c) feeding behavior
Fig. 9. Training curve of the fully connected neural network model. (a) Loss curve; (b) accuracy curve
|
Table 1. Vector format of feature part spatial relationship
|
Table 2. Training accuracy of the YOLOv5s model unit: %
|
Table 3. Classification accuracy of fully connected neural network model unit: %
|
Table 4. Classification accuracy of decision tree model unit: %
|
Table 5. Statistics of cattle behavior time

Set citation alerts for the article
Please enter your email address
© Copyright 2018-2021 | Chinese Laser Press. All Rights Reserved 沪ICP备15018463号-20