
Yi Zhao, Qiuping Huang, Honglei Cai, Xiaoxia Lin, Hongchuan He, Hao Cheng, Tian Ma, Yalin Lu. Ultrafast control of slow light in THz electromagnetically induced transparency metasurfaces[J]. Chinese Optics Letters, 2021, 19(7): 073602
- Chinese Optics Letters
- Vol. 19, Issue 7, 073602 (2021)
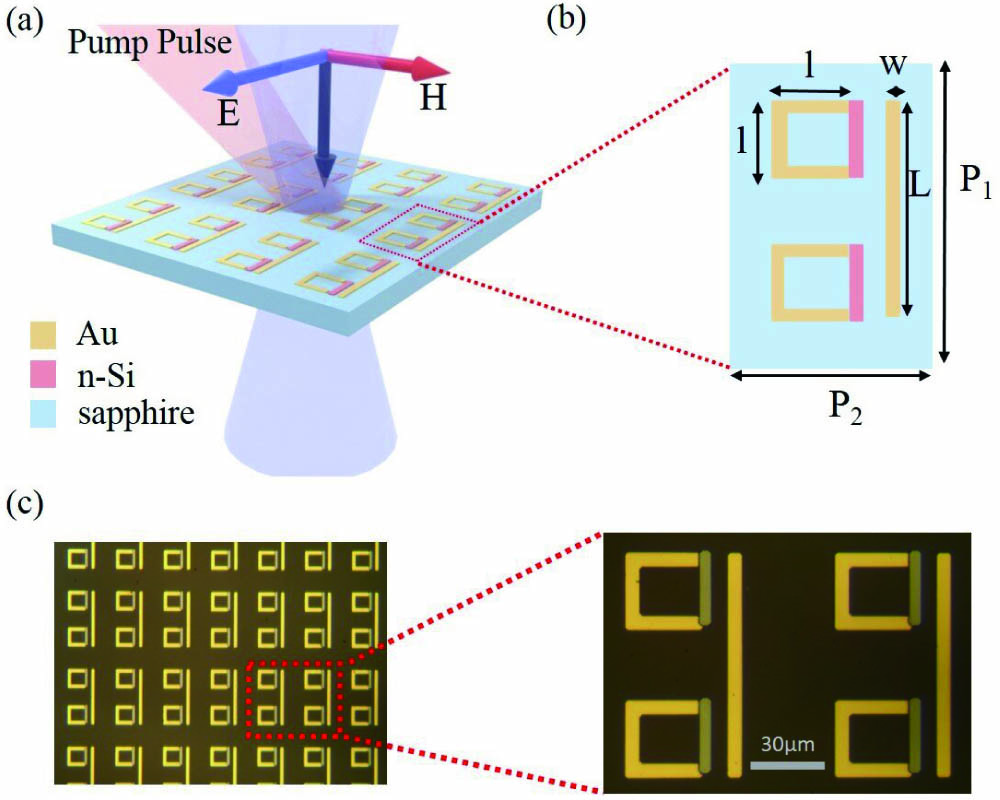
Fig. 1. (a) Schematic of the ultrafast EIT metasurface. (b) Parameters of structure: P1 = 120 µm, P2 = 80 µm, L = 85 µm, w = 5 µm, and l = 29 µm. (c) Microscopy image of the fabricated sample.
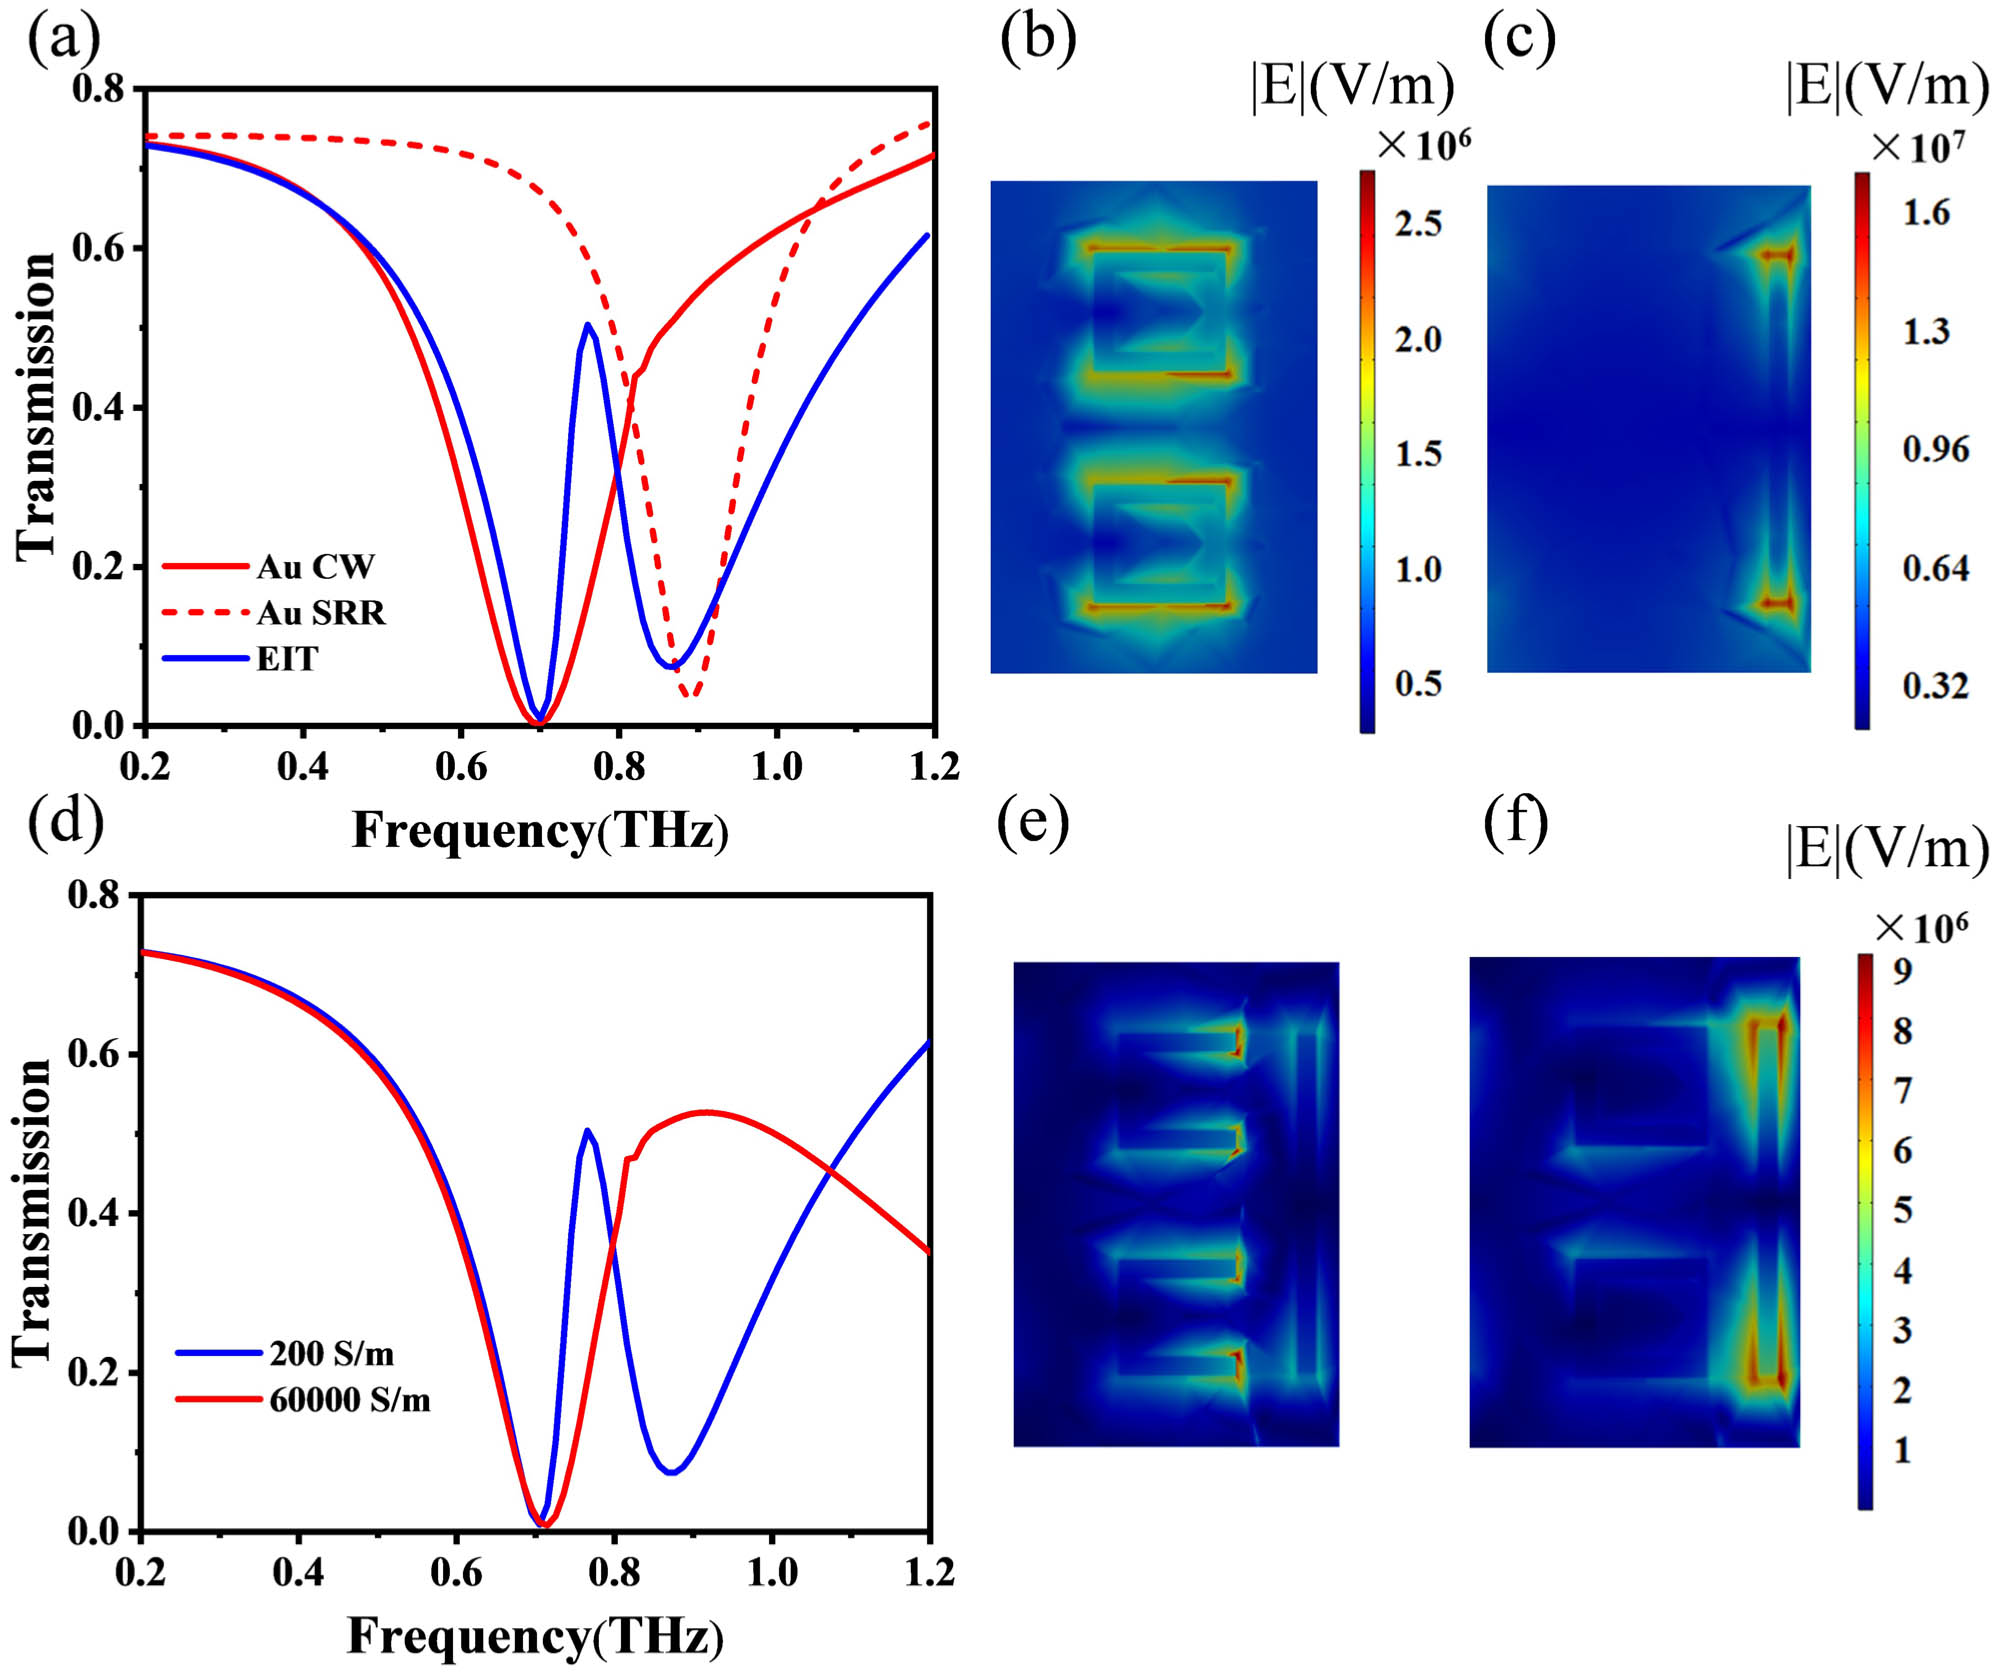
Fig. 2. (a) Simulated transmission spectra of Au CW, Au SRRs, and EIT sample, respectively. Electric field distribution of (b) Au SRRs at 0.89 THz and (c) Au CW at 0.7 THz. (d) Simulated transmission spectra of the EIT metasurface with different Si conductivity. Electric field distributions at 0.76 THz when Si conductivity is (e) 200 S/m and (f) 60,000 S/m (in our simulation, the absolute value of the electric field intensity of the incident wave is 2.8 × 10⁵ V/m).
Fig. 3. Schematic illustration of the OPTP system. The ultrafast femtosecond laser beam is split into three beams, respectively, used for THz generation, THz detection, and ultrafast optical pump.
Fig. 4. (a) Differential change in transmitted THz peak signal as a function of pump–probe delay. Black dots indicate the specific time delay of our test. (b) Experimental transmission spectra at different time delays. (c) Time-dependent Δtg retrieved from measured transmission spectra. (d) Time-dependent Δtg at 0.78 THz.
Fig. 5. (a) Experimental transmission spectrum mapping as a function of pump–probe delay. (b) Differential change in transmitted THz peak signal as a function of pump–probe delay for Si films with different implanted conditions. The solid curve represents the single exponential fitting with a time constant of τ.
Fig. 6. (a)–(e) Simulated transmission spectra with Si conductivity varied between 200 S/m and 60,000 S/m (red dots) and the corresponding fitting lines (black lines). (f) The fitted parameters with different Si conductivity.

Set citation alerts for the article
Please enter your email address
© Copyright 2018-2021 | Chinese Laser Press. All Rights Reserved 沪ICP备15018463号-20