
Zhihong Xi, Caiyan Hou, Kunpeng Yuan, Zhuoqun Xue. Super-Resolution Reconstruction of Accelerated Image Based on Deep Residual Network[J]. Acta Optica Sinica, 2019, 39(2): 0210003
- Acta Optica Sinica
- Vol. 39, Issue 2, 0210003 (2019)
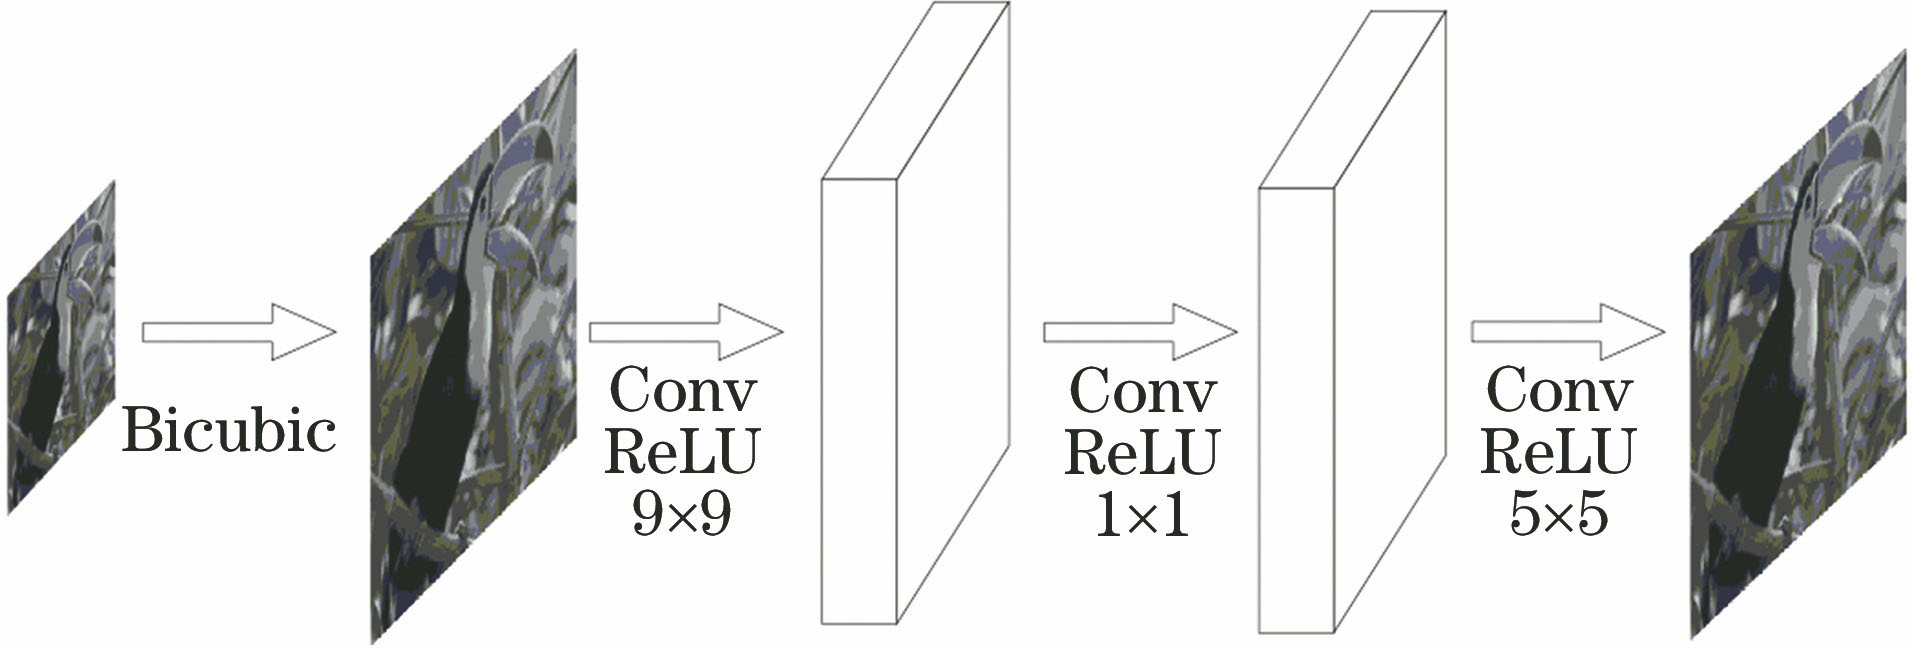
Fig. 1. Diagram of SRCNN structure
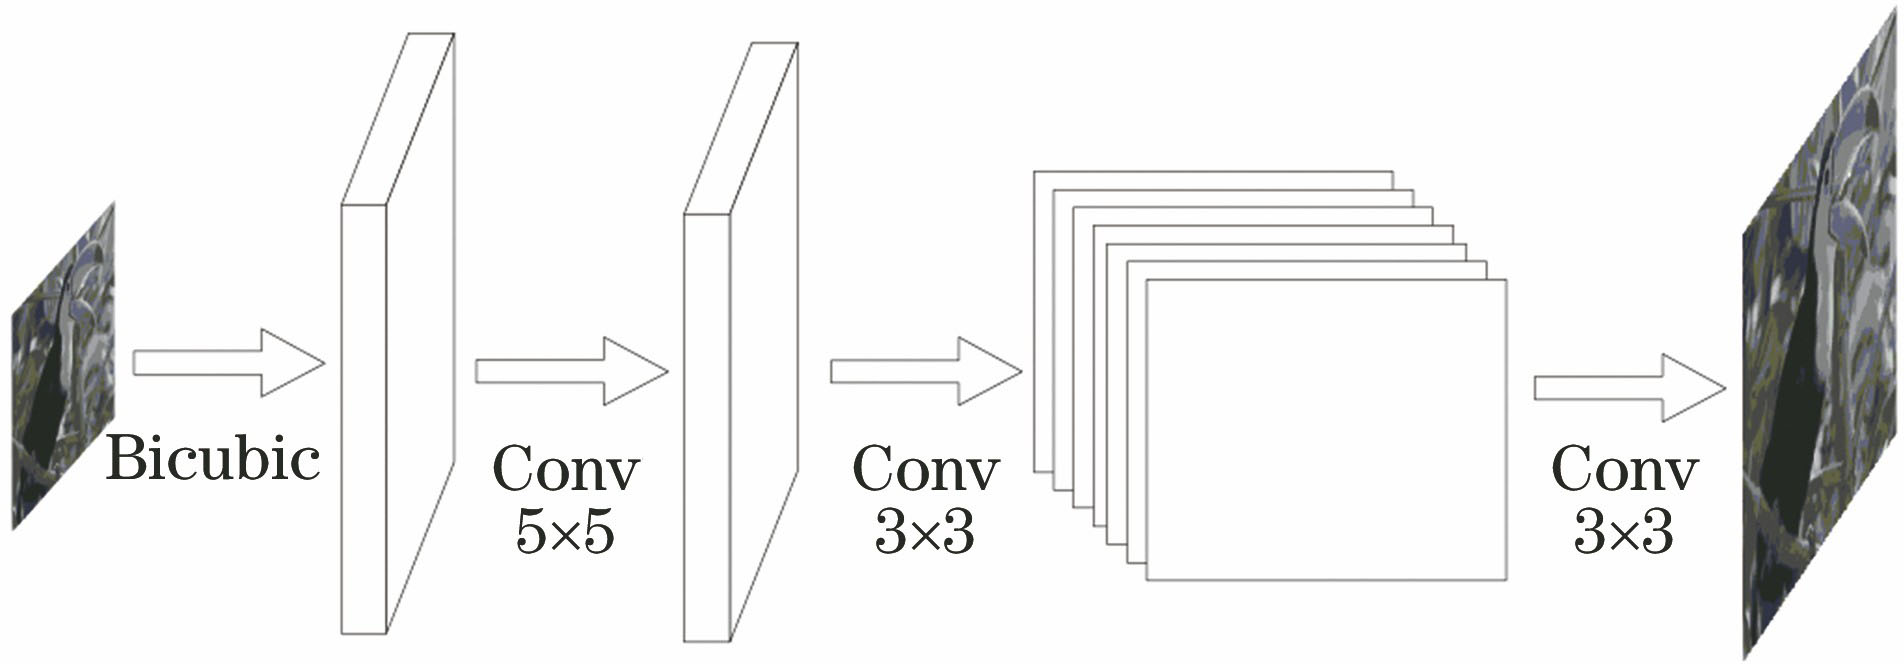
Fig. 2. Diagram of ESPCN structure
Fig. 3. Diagram of network structure of the proposed algorithm
Fig. 4. Residual network structure
Fig. 5. (a) Variation of loss function of 12-layer network with number of iterations; (b) variation of PSNR average value of set 5 with number of iterations under different layers
Fig. 6. Variation of PSNR average value of set 5 under different activation functions with number of iterations
Fig. 7. Relationship between running time and PSNR average value of set 5 under different algorithms
Fig. 8. Variation of PSNR average value of set 5 under different optimization methods with number of iterations
Fig. 9. Variation of PSNR average value of set 5 under different filter numbers with number of iterations
Fig. 10. Variation of PSNR average value of set 5 under different network models with number of iterations. (a) Networks of 6-layer and 8-layer; (b) networks of 10-layer and 12-layer
Fig. 11. Effect of Monarch under different algorithms
Fig. 12. Effect of Comic under different algorithms
| ||||||||||||||||||||||||||||
Table 1. PSNR/SSIM average values of test sets at different depths
|
Table 2. PSNR average value of set 5, set 14, and BSD100 under different algorithms
|
Table 3. SSIM average value of set 5, set 14, and BSD100 under different algorithms

Set citation alerts for the article
Please enter your email address
© Copyright 2018-2021 | Chinese Laser Press. All Rights Reserved 沪ICP备15018463号-20