• Acta Optica Sinica
  • Vol. 39, Issue 11, 1131002 (2019)
Dongmei Liu1、**, Pengfei Yue1、*, Xiuhua Fu1, Jing Zhang1, HongYu Cao1, and Shuang Li2
Author Affiliations
  • 1School of Optoelectronic Engineering, Changchun University of Science and Technology, Changchun, Jilin 130022, China
  • 2Optorun (Shanghai) Co., Ltd., Shanghai 200444, China
  • show less
    DOI: 10.3788/AOS201939.1131002 Cite this Article Set citation alerts
    Dongmei Liu, Pengfei Yue, Xiuhua Fu, Jing Zhang, HongYu Cao, Shuang Li. Development of Iris Recognition Filter with Low-Angle Effect[J]. Acta Optica Sinica, 2019, 39(11): 1131002 Copy Citation Text show less
    Optical constants of Si-H materials under different H2 gas flows. (a) Refractive index; (b) extinction coefficient
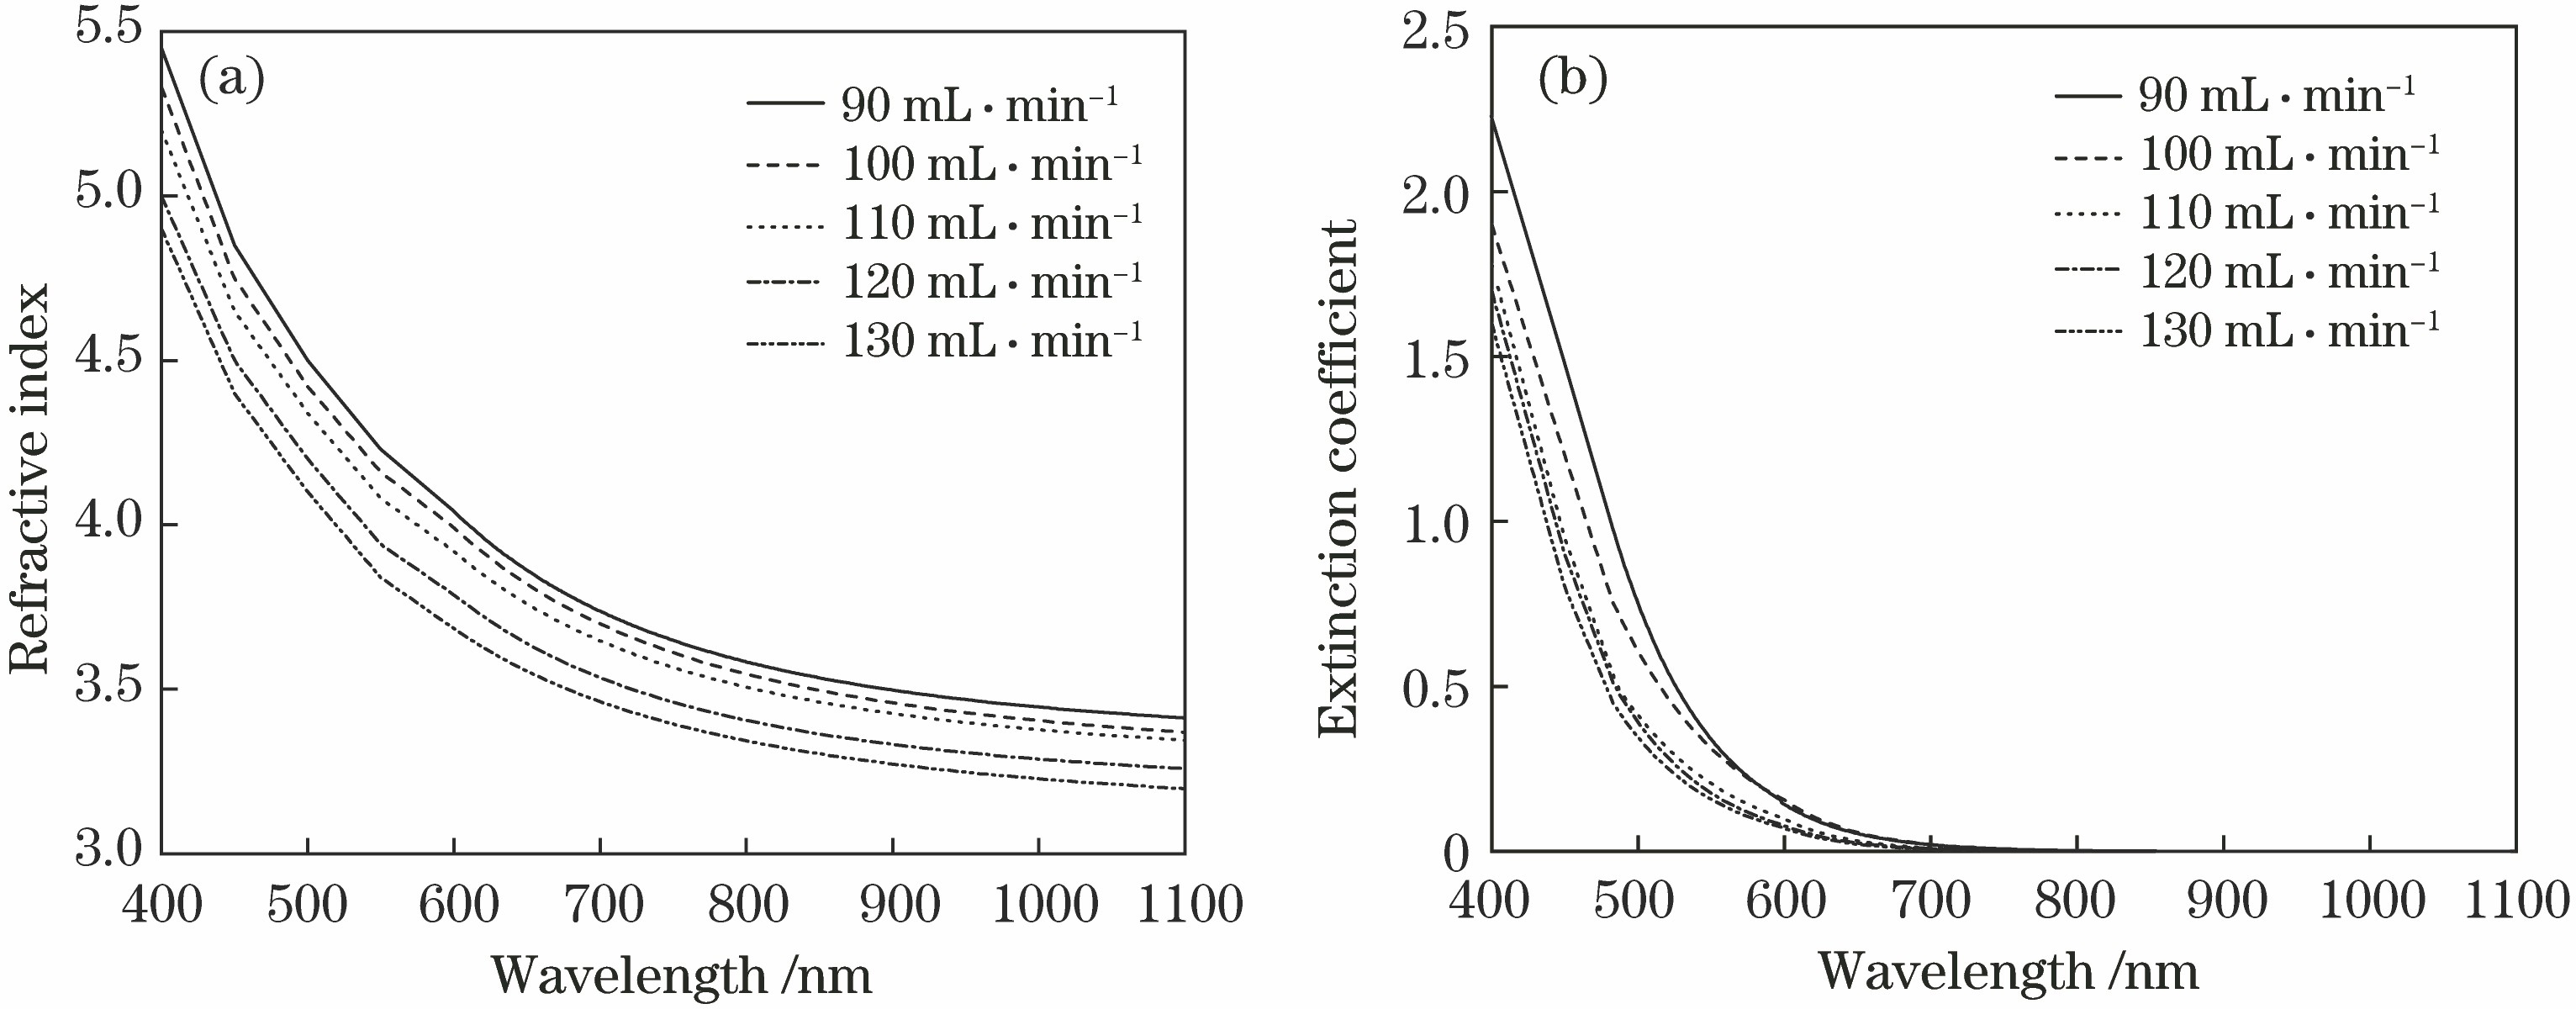
    Fig. 1. Optical constants of Si-H materials under different H2 gas flows. (a) Refractive index; (b) extinction coefficient
    Optical constants of Si-H materials. (a) Refractive index; (b) extinction coefficient
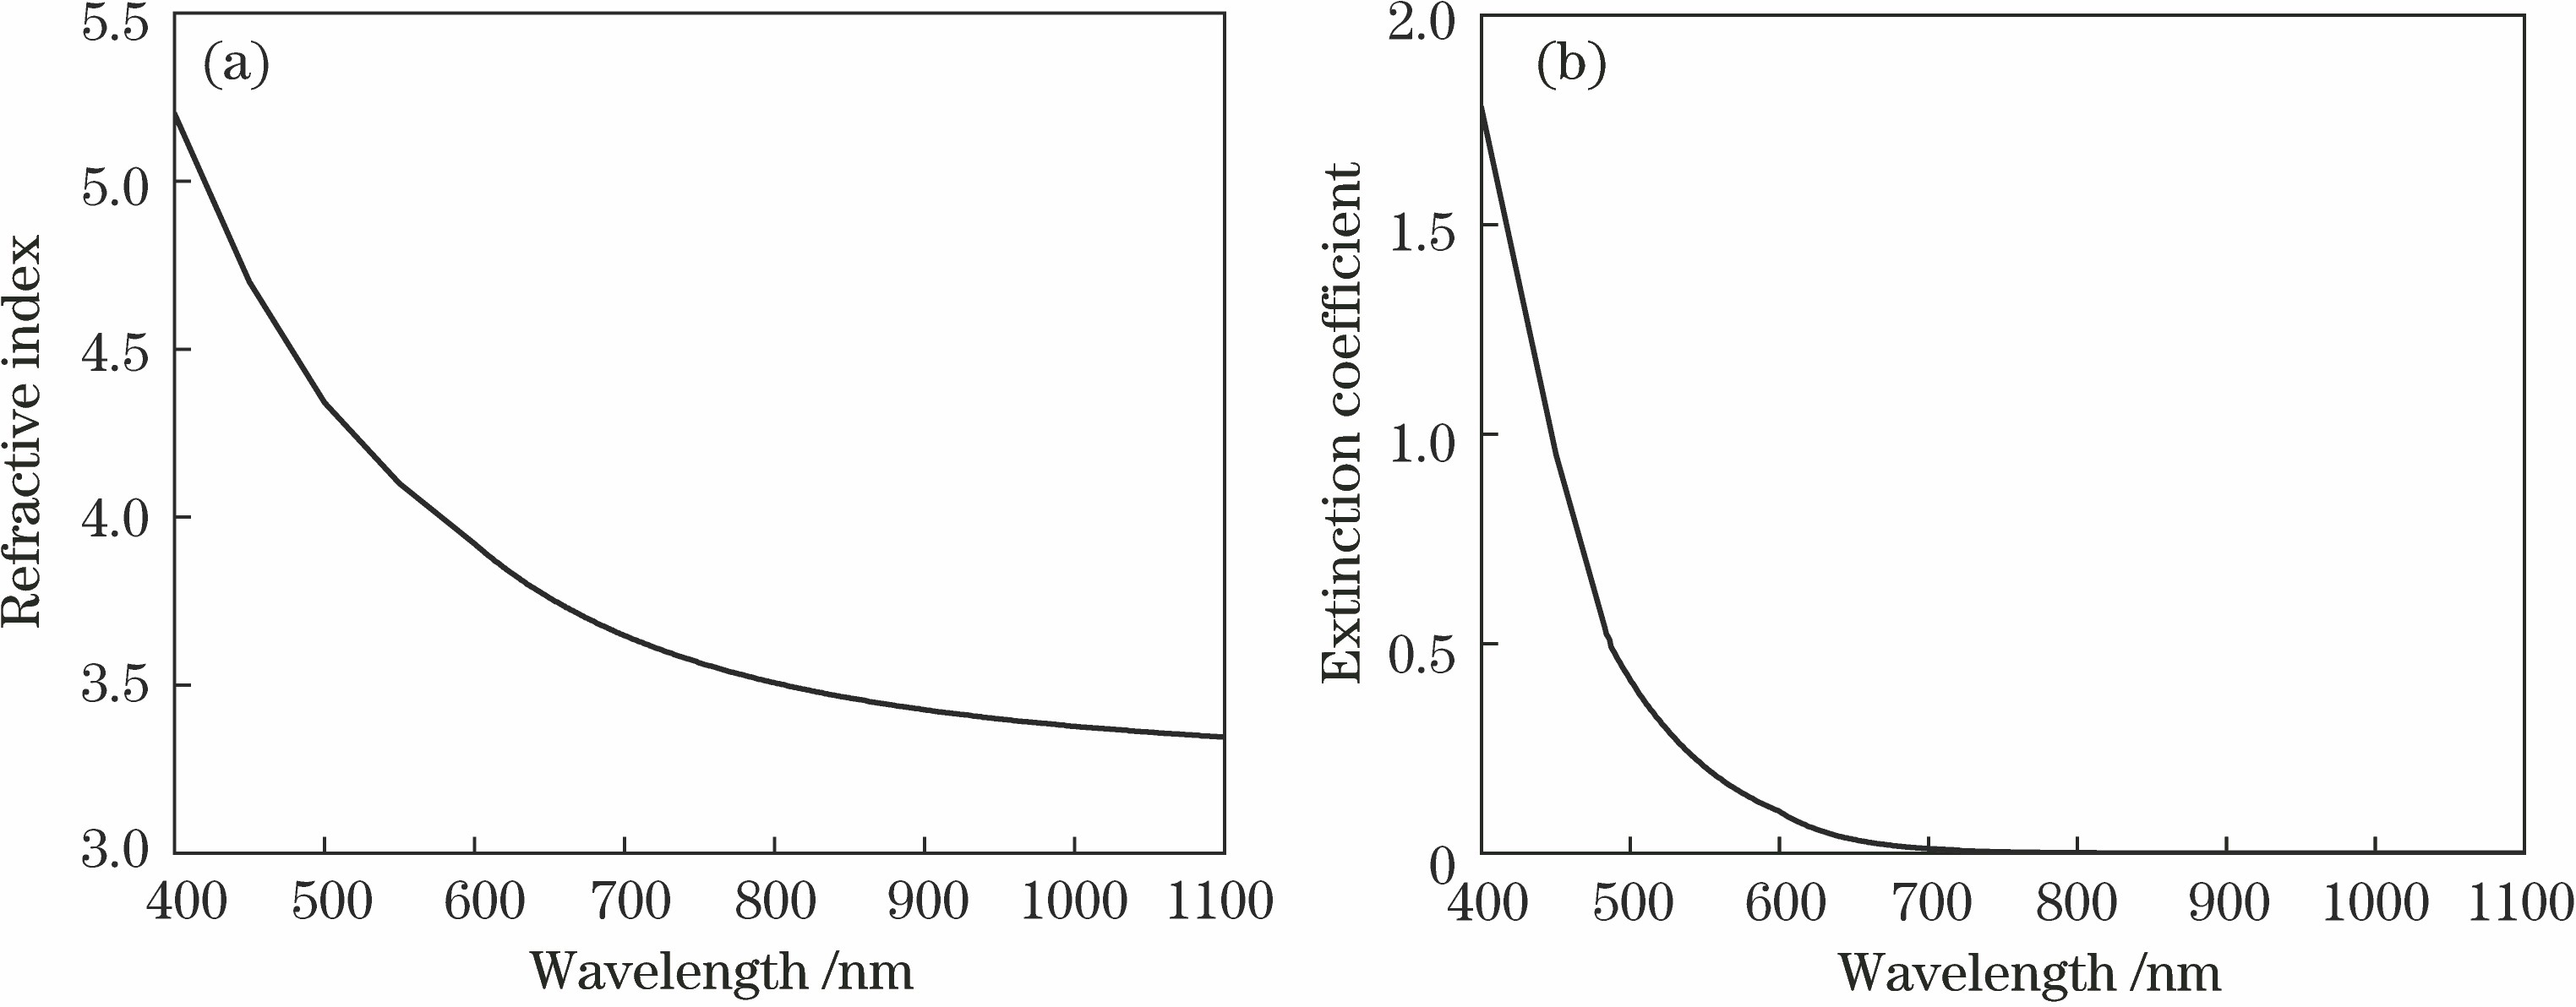
    Fig. 2. Optical constants of Si-H materials. (a) Refractive index; (b) extinction coefficient
    Optical constants of Si3N4 materials. (a) Refractive index; (b) extinction coefficient
    Fig. 3. Optical constants of Si3N4 materials. (a) Refractive index; (b) extinction coefficient
    Optical constants of SiO2 materials. (a) Refractive index; (b) extinction coefficient
    Fig. 4. Optical constants of SiO2 materials. (a) Refractive index; (b) extinction coefficient
    Front surface theoretical spectral curve
    Fig. 5. Front surface theoretical spectral curve
    Back surface theoretical spectral curve
    Fig. 6. Back surface theoretical spectral curve
    Double-sided transmission theoretical spectral curve
    Fig. 7. Double-sided transmission theoretical spectral curve
    Front surface spectral test curve
    Fig. 8. Front surface spectral test curve
    Back surface spectral test curve
    Fig. 9. Back surface spectral test curve
    Spectral test curve of sample 1 after boiling for 0.5 h
    Fig. 10. Spectral test curve of sample 1 after boiling for 0.5 h
    Spectral test curve of sample 1 after adjusting the process and boiling for 0.5 h
    Fig. 11. Spectral test curve of sample 1 after adjusting the process and boiling for 0.5 h
    Comparison of design curve and actual test curve
    Fig. 12. Comparison of design curve and actual test curve
    ItemAOI
    38°
    Shift /nm-<20
    Low-stopband (min) /nm400400
    Low-stopband (max) /nm890-920870-900
    SW-transmission (average) /%<0.1<0.1
    SW-transmission (max) /%<1.0<1.0
    Centre wavelength /nm950930
    Passband /nm925-975905-955
    Passband-transmission (average) /%≥92≥92
    Full width at half maximum /nm52-5852-58
    High-stopband (min) /nm980-1010960-990
    High-stopband (max) /nm11001100
    LW-transmission (average) /%<0.3<0.3
    LW-transmission (max) /%<0.5<0.5
    Table 1. Designed spectral parameters of filter
    Gas flow /(mL·min-1)nk
    903.4691.79×10-4
    1003.4291.37×10-4
    1103.4003.93×10-5
    1203.3083.40×10-5
    1303.2492.28×10-5
    Table 2. Optical constants of Si-H at 950 nm under different H2 gas flows
    Materialsnk
    Si-H3.4003.93×10-5
    Si3N42.0151.85×10-6
    SiO21.4420
    Table 3. Optical constants of materials used in design
    MaterialsTG1/2-SiICP*2
    Power /kWAr flow /(mL·min-1)Power /kWAr flow /(mL·min-1)O2 flow /(mL·min-1)H2 flow /(mL·min-1)N2 flow /(mL·min-1)
    Si-H13280360001100
    Si3N412280260000560
    SiO215280412024000
    Table 4. Process parameters
    Dongmei Liu, Pengfei Yue, Xiuhua Fu, Jing Zhang, HongYu Cao, Shuang Li. Development of Iris Recognition Filter with Low-Angle Effect[J]. Acta Optica Sinica, 2019, 39(11): 1131002
    Download Citation