• Chinese Optics Letters
  • Vol. 18, Issue 4, 042604 (2020)
Xin Wang1、2, Honglin Liu1、*, Meijun Chen1、2, Zhentao Liu1, and Shensheng Han1
Author Affiliations
  • 1Key Laboratory of Quantum Optics, Shanghai Institute of Optics and Fine Mechanics, Chinese Academy of Sciences, Shanghai 201800, China
  • 2Center of Materials Science and Optoelectronics Engineering, University of Chinese Academy of Sciences, Beijing 100049, China
  • show less
    DOI: 10.3788/COL202018.042604 Cite this Article Set citation alerts
    Xin Wang, Honglin Liu, Meijun Chen, Zhentao Liu, Shensheng Han. Imaging through dynamic scattering media with stitched speckle patterns[J]. Chinese Optics Letters, 2020, 18(4): 042604 Copy Citation Text show less
    Schematic illustration of stitching. (a) A big speckle pattern is split into many subblocks, and each subblock has its own independent PSFk. In other words, the big speckle pattern is obtained by stitching all independent subblocks together. (b) The segmentation of a big speckle pattern I.
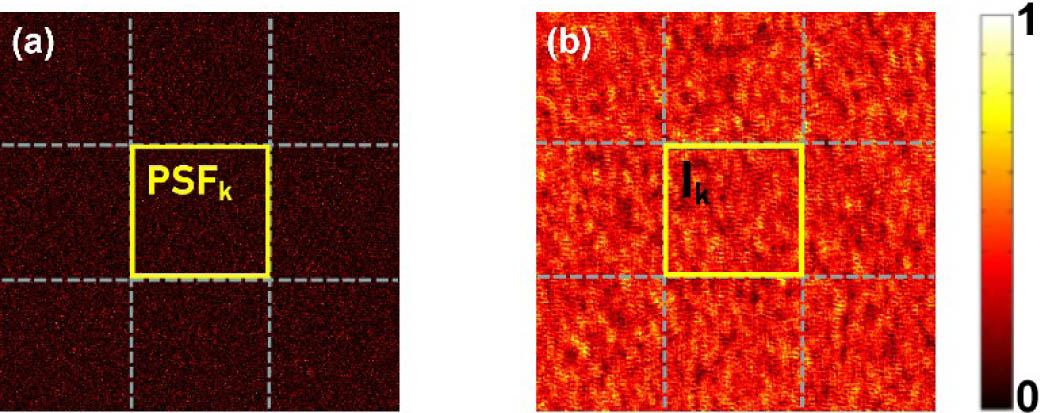
    Fig. 1. Schematic illustration of stitching. (a) A big speckle pattern is split into many subblocks, and each subblock has its own independent PSFk. In other words, the big speckle pattern is obtained by stitching all independent subblocks together. (b) The segmentation of a big speckle pattern I.
    Diagram of piecing together a series of speckle patterns {Itk}k=1n×n [shown as subfigure (a)] into (b) a big speckle pattern; the yellow square frame denotes a single speckle pattern Itk.
    Fig. 2. Diagram of piecing together a series of speckle patterns {Itk}k=1n×n [shown as subfigure (a)] into (b) a big speckle pattern; the yellow square frame denotes a single speckle pattern Itk.
    Experimental setup. u and v are distances from the object and the camera to the scattering layer, respectively.
    Fig. 3. Experimental setup. u and v are distances from the object and the camera to the scattering layer, respectively.
    Experimental results. Rows I, II, and III correspond to R=10.8, 5.4, and 3.6, respectively. (a) Examples of captured speckle patterns, and (b) the corresponding autocorrelations of (a). (c) The power spectra of (a), (d) the averaged power spectra, and (e) the images reconstructed from (d). (f) The stitched speckle patterns at different sampling ratios and numbers of frames: R=10.8, 4×4 frames (row I); R=5.4, 8×8 frames (row II); and R=3.6, 12×12 frames (row III), respectively. (g) The corresponding power spectra of (f), and (h) the images reconstructed from (g). (II,i) The autocorrelation and (III,i) the frequency spectrum of (I,i), the object. The inserts in rows II and III, and columns (c), (d), and (h) show zoom-ins of the center dash squares.
    Fig. 4. Experimental results. Rows I, II, and III correspond to R=10.8, 5.4, and 3.6, respectively. (a) Examples of captured speckle patterns, and (b) the corresponding autocorrelations of (a). (c) The power spectra of (a), (d) the averaged power spectra, and (e) the images reconstructed from (d). (f) The stitched speckle patterns at different sampling ratios and numbers of frames: R=10.8, 4×4 frames (row I); R=5.4, 8×8 frames (row II); and R=3.6, 12×12 frames (row III), respectively. (g) The corresponding power spectra of (f), and (h) the images reconstructed from (g). (II,i) The autocorrelation and (III,i) the frequency spectrum of (I,i), the object. The inserts in rows II and III, and columns (c), (d), and (h) show zoom-ins of the center dash squares.
    Simulation results of different stitching numbers at R=2. Row I. (a) A single original speckle pattern; and (b) 4, (c) 9, (d) 36, and (e) 64 original patterns stitched together equally in two directions. Row II. The autocorrelations corresponding to I. Row III. The respective images reconstructed. Row IV. The averaged power spectra of 1, 4, 9, 36, and 64 frames of the original patterns. Row V. The corresponding power spectra of row I. (f) The evolution of the correlation coefficient with stitching number n. In rows IV and V, all have the same spectrum range because of the same pixel pitch. However, the power spectra of the stitched patterns have a higher resolution determined by the array size, which can be seen clearly from the amplified dash squares.
    Fig. 5. Simulation results of different stitching numbers at R=2. Row I. (a) A single original speckle pattern; and (b) 4, (c) 9, (d) 36, and (e) 64 original patterns stitched together equally in two directions. Row II. The autocorrelations corresponding to I. Row III. The respective images reconstructed. Row IV. The averaged power spectra of 1, 4, 9, 36, and 64 frames of the original patterns. Row V. The corresponding power spectra of row I. (f) The evolution of the correlation coefficient with stitching number n. In rows IV and V, all have the same spectrum range because of the same pixel pitch. However, the power spectra of the stitched patterns have a higher resolution determined by the array size, which can be seen clearly from the amplified dash squares.
    Simulation results of different sampling ratios R. Row I. (a) A speckle pattern at R=8, and stitched speckle patterns of different sampling ratios and numbers of frames: (b) R=4, 2×2 frames; (c) R=2, 4×4 frames; (d) R=1, 8×8 frames; and (e) R=0.8, 10×10 frames, respectively. Row II. Autocorrelations corresponding to I. Row III. Reconstructed images, respectively. Row IV. Averaged power spectra. Row V. Corresponding power spectra of I (b)–(e). (f) The evolution of the correlation coefficient versus sampling ratio R. Again, all power spectra in rows IV and V have the same spectral range but different resolutions.
    Fig. 6. Simulation results of different sampling ratios R. Row I. (a) A speckle pattern at R=8, and stitched speckle patterns of different sampling ratios and numbers of frames: (b) R=4, 2×2 frames; (c) R=2, 4×4 frames; (d) R=1, 8×8 frames; and (e) R=0.8, 10×10 frames, respectively. Row II. Autocorrelations corresponding to I. Row III. Reconstructed images, respectively. Row IV. Averaged power spectra. Row V. Corresponding power spectra of I (b)–(e). (f) The evolution of the correlation coefficient versus sampling ratio R. Again, all power spectra in rows IV and V have the same spectral range but different resolutions.
    Xin Wang, Honglin Liu, Meijun Chen, Zhentao Liu, Shensheng Han. Imaging through dynamic scattering media with stitched speckle patterns[J]. Chinese Optics Letters, 2020, 18(4): 042604
    Download Citation