• Laser & Optoelectronics Progress
  • Vol. 58, Issue 22, 2230003 (2021)
Xinyi Fang1, Xiaoxia Wan1、*, Shuo Shi2, Xiao Teng1, and Junyan Yu1
Author Affiliations
  • 1Color Science Laboratory, School of Printing and Packaging, Wuhan University, Wuhan, Hubei 430079, China
  • 2State Key Laboratory of Information Engineering in Surveying, Mapping and Remote Sensing, Wuhan University, Wuhan, Hubei 430079, China
  • show less
    DOI: 10.3788/LOP202158.2230003 Cite this Article Set citation alerts
    Xinyi Fang, Xiaoxia Wan, Shuo Shi, Xiao Teng, Junyan Yu. Multi-Spectral Color Data Dimension Reduction Model Research Based on Sparse Representation[J]. Laser & Optoelectronics Progress, 2021, 58(22): 2230003 Copy Citation Text show less
    RMSE distribution of each sample with SG color card as training set and Munsell color block as testset when each sample is reduced to six dimensions and reconstructed. (a) Spectral error distribution diagram obtained by PCA method; (b) spectral error distribution diagram obtained by SR method; (c) RMSE curve obtained by PCA method; (d) RMSE curve obtained by SR method
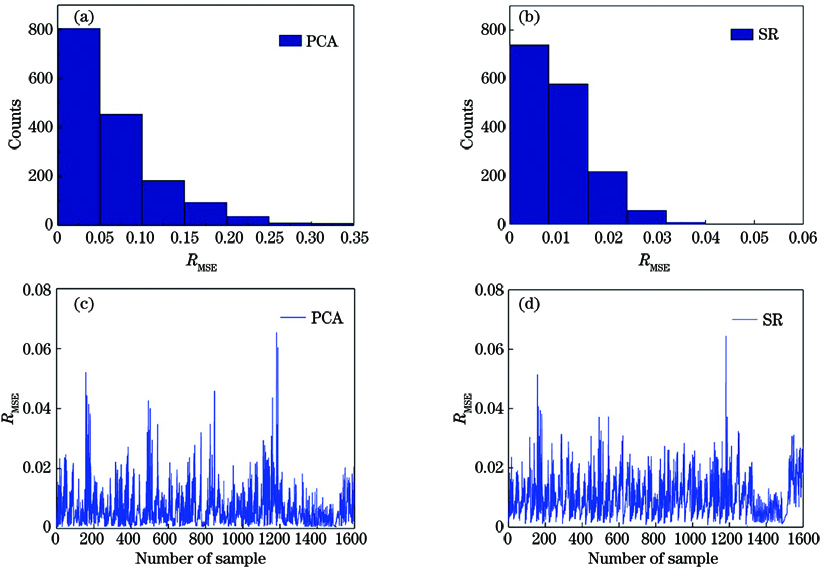
    Fig. 1. RMSE distribution of each sample with SG color card as training set and Munsell color block as testset when each sample is reduced to six dimensions and reconstructed. (a) Spectral error distribution diagram obtained by PCA method; (b) spectral error distribution diagram obtained by SR method; (c) RMSE curve obtained by PCA method; (d) RMSE curve obtained by SR method
    Partial sample spectral reflectance curve, and reconstructed spectral curve based on PCA method and SR method. (a) Samples with high fitting degree; (b) samples of general fitness; (c) samples with poor fit
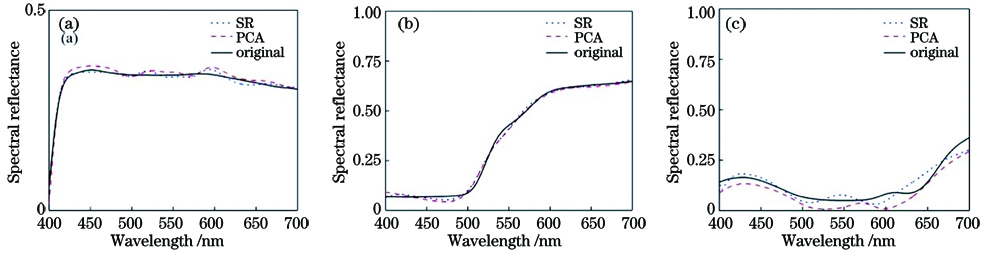
    Fig. 2. Partial sample spectral reflectance curve, and reconstructed spectral curve based on PCA method and SR method. (a) Samples with high fitting degree; (b) samples of general fitness; (c) samples with poor fit
    Multispectral images from the University of Eastern Finland spectral image database. (a) Original image; (b) image reduced in dimension and reconstructed by SR method
    Fig. 3. Multispectral images from the University of Eastern Finland spectral image database. (a) Original image; (b) image reduced in dimension and reconstructed by SR method
    DatasetDimensionMethodRMSEGFC /%
    MeanMaxMinMeanMaxMin
    Munsell-SG6PCA0.0170.0480.00399.82599.99998.066
    SR0.0110.0390.00299.88499.99897.905
    5
    PCA0.0160.0440.00499.79799.99797.626
    SR0.0150.0400.00299.82899.99497.620
    4
    PCA0.0200.0680.00499.62699.99593.961
    SR0.0190.0680.00399.64899.99493.779
    3
    PCA0.0260.0850.00699.31499.99293.793
    SR0.0250.0860.00399.37599.98493.485
    SG-Munsell6PCA0.0680.6550.00599.29899.99376.455
    SR0.0100.0640.00199.90099.99792.273
    5
    PCA0.0510.3230.00599.45099.99369.969
    SR0.0150.0660.00299.80599.99791.971
    4
    PCA0.0470.2530.00599.38399.99377.736
    SR0.0180.0880.00299.66799.99786.454
    3
    PCA0.0410.1020.00499.33599.98685.781
    SR0.0250.0980.00299.41599.99484.614
    Table 1. Comparison of spectral reconstruction accuracy between SR method and PCA method
    DatasetMethodΔE00
    MeanMaxMin
    Munsell-SGPCA1.5179.9040.047
    SR0.4512.3280.049
    SG-MunsellPCA5.93952.7270.222
    SR0.4304.6750.011
    Table 2. Comparison of chromaticity reconstruction accuracy between SR method and PCA method, under D65 light source
    DatasetMethodACD65D50
    Munsell-SGPCA1.3991.5281.5171.453
    SR0.2770.5010.4510.373
    SG-MunsellPCA6.2515.9725.9396.072
    SR0.2760.4850.4300.367
    Table 3. Average color difference comparison under different light sources
    Xinyi Fang, Xiaoxia Wan, Shuo Shi, Xiao Teng, Junyan Yu. Multi-Spectral Color Data Dimension Reduction Model Research Based on Sparse Representation[J]. Laser & Optoelectronics Progress, 2021, 58(22): 2230003
    Download Citation