• Acta Optica Sinica
  • Vol. 38, Issue 7, 0724001 (2018)
Xiaofeng Shi, Xinmin Zhang, Xia Yan, Lizhen Ma, Xu Zhang, Haikuan Ma, and Jun Ma*
Author Affiliations
  • Laboratory of Optics & Optoelectronics, Ocean University of China, Qingdao, Shandong 266100, China
  • show less
    DOI: 10.3788/AOS201838.0724001 Cite this Article Set citation alerts
    Xiaofeng Shi, Xinmin Zhang, Xia Yan, Lizhen Ma, Xu Zhang, Haikuan Ma, Jun Ma. Detection of Polycyclic Aromatic Hydrocarbons (PAHs) in Water Based on Three-Dimensional Surface-Enhanced Raman Scattering Substrates[J]. Acta Optica Sinica, 2018, 38(7): 0724001 Copy Citation Text show less
    Schematic of polymerization reaction of GMA-EDMA porous material
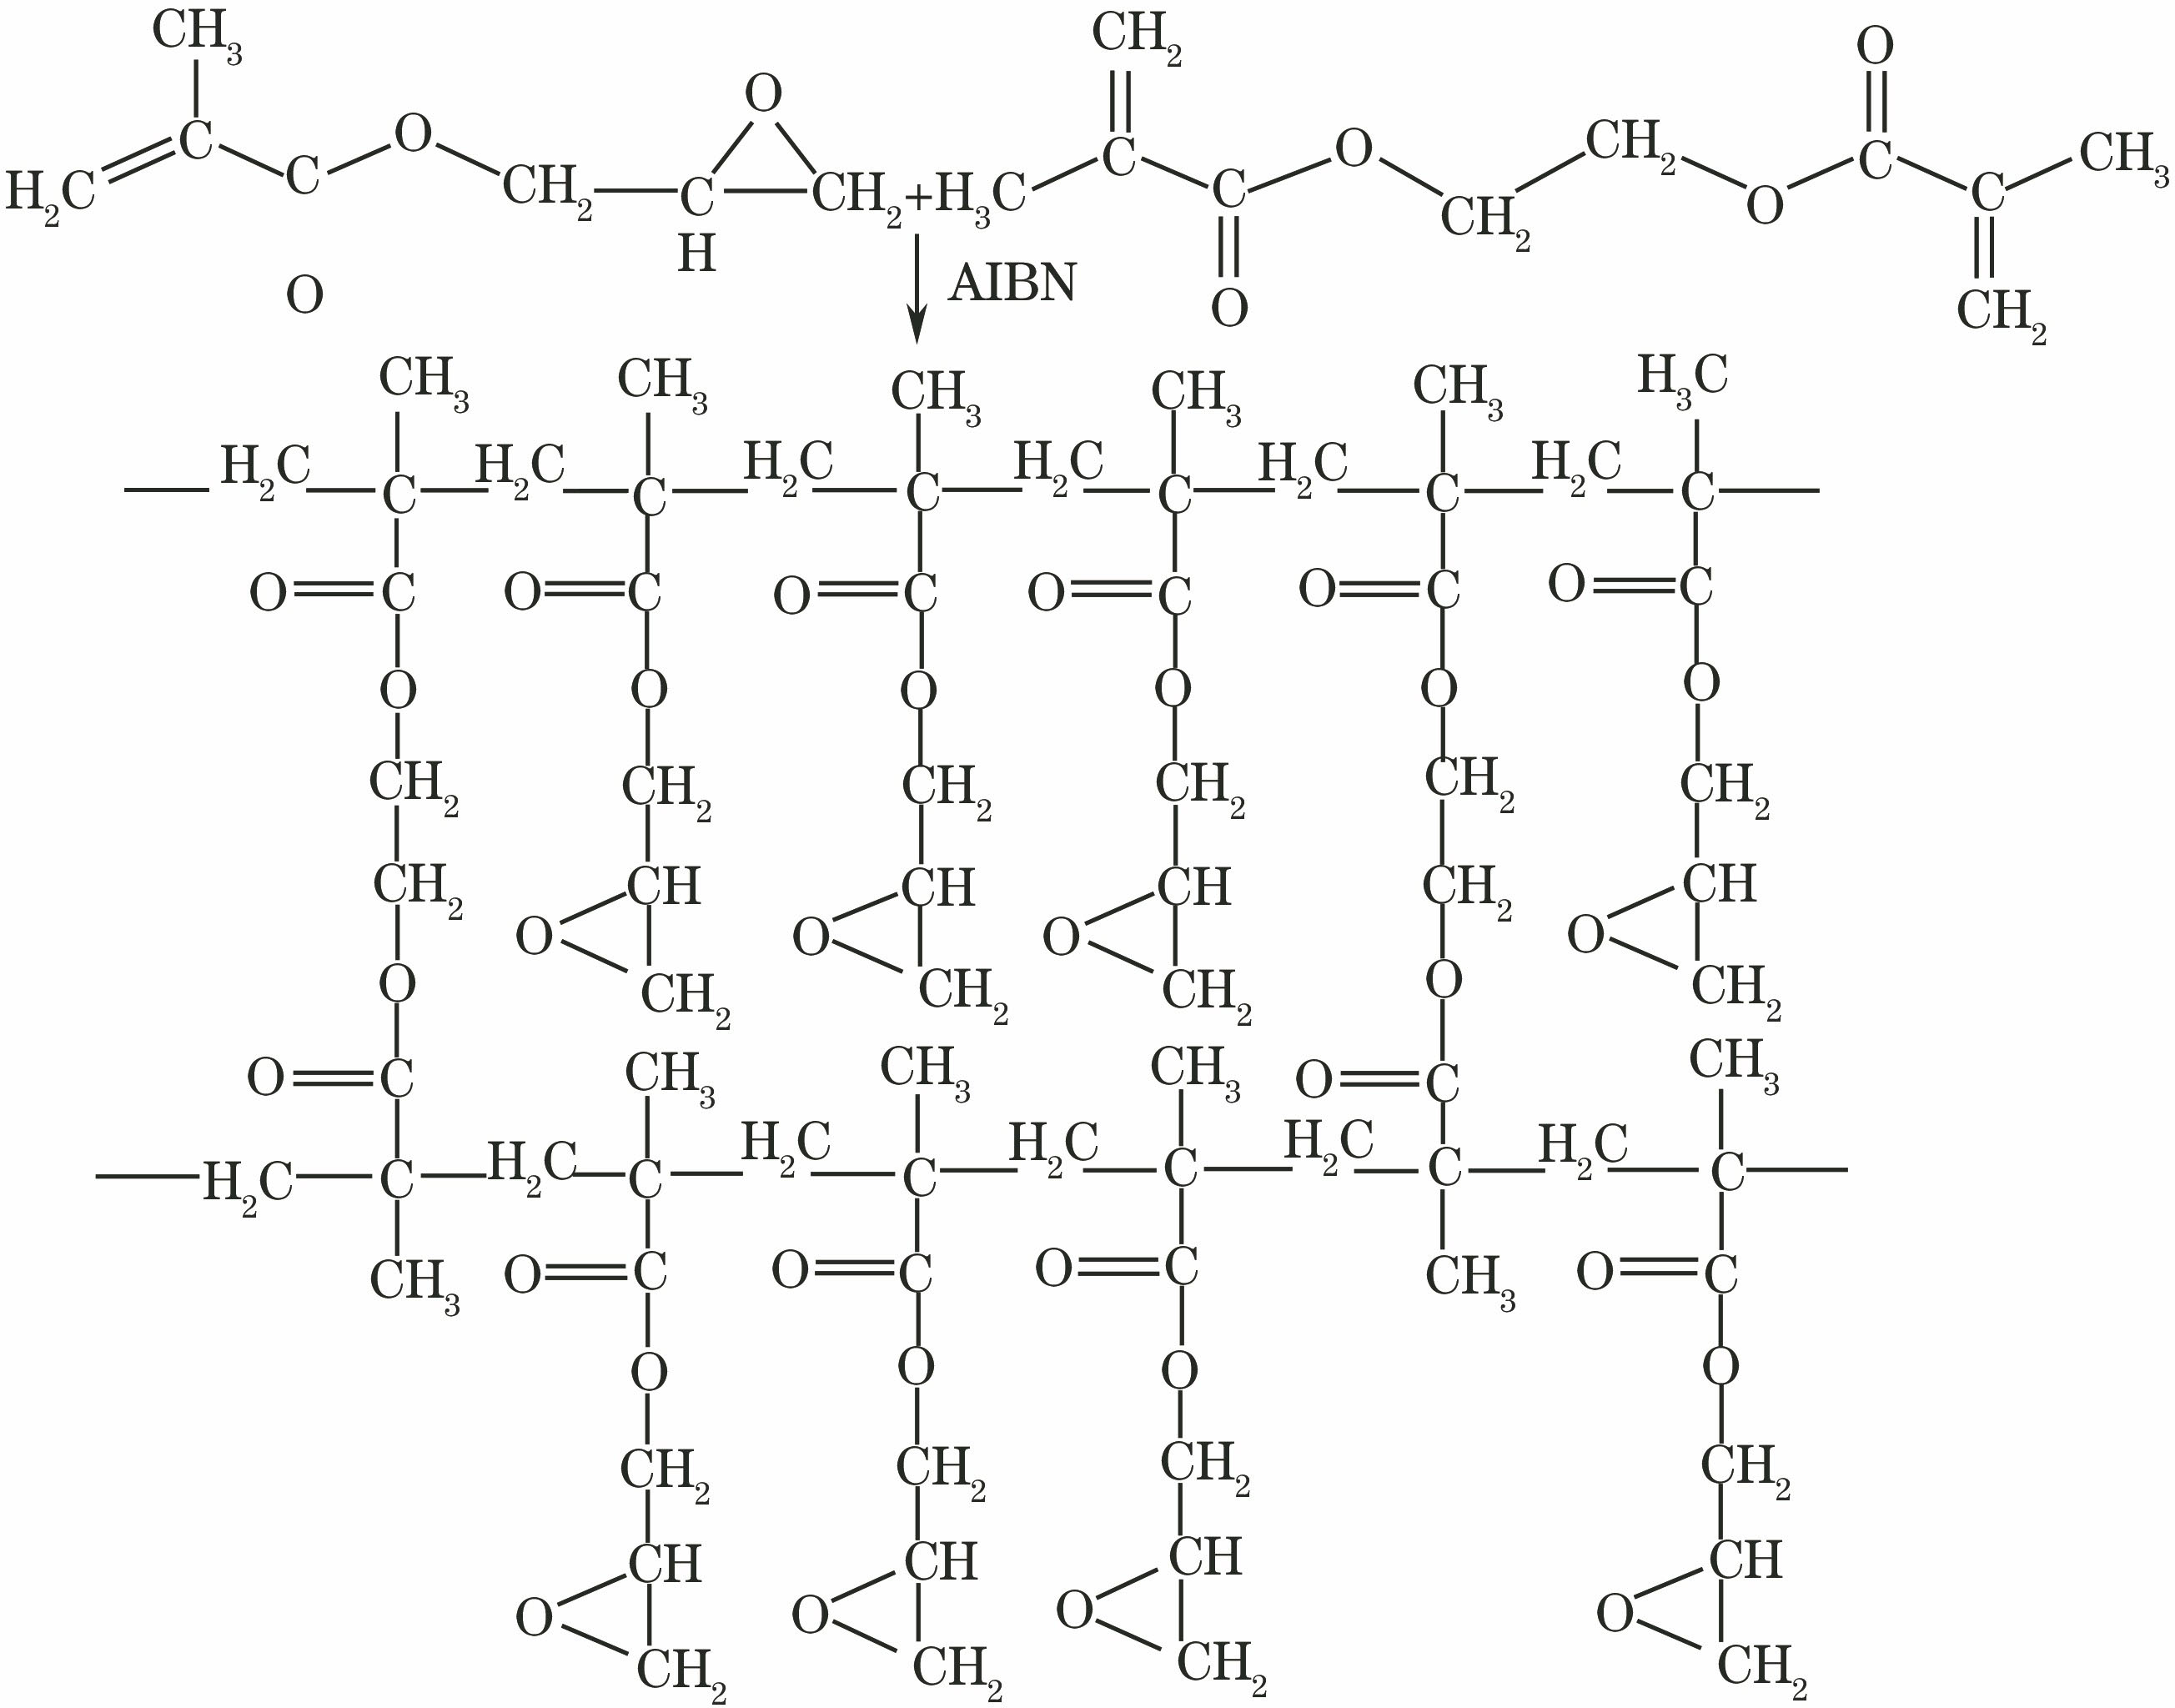
    Fig. 1. Schematic of polymerization reaction of GMA-EDMA porous material
    Flow chart of preparation of 3D SERS substrates and spectra collection of SERS
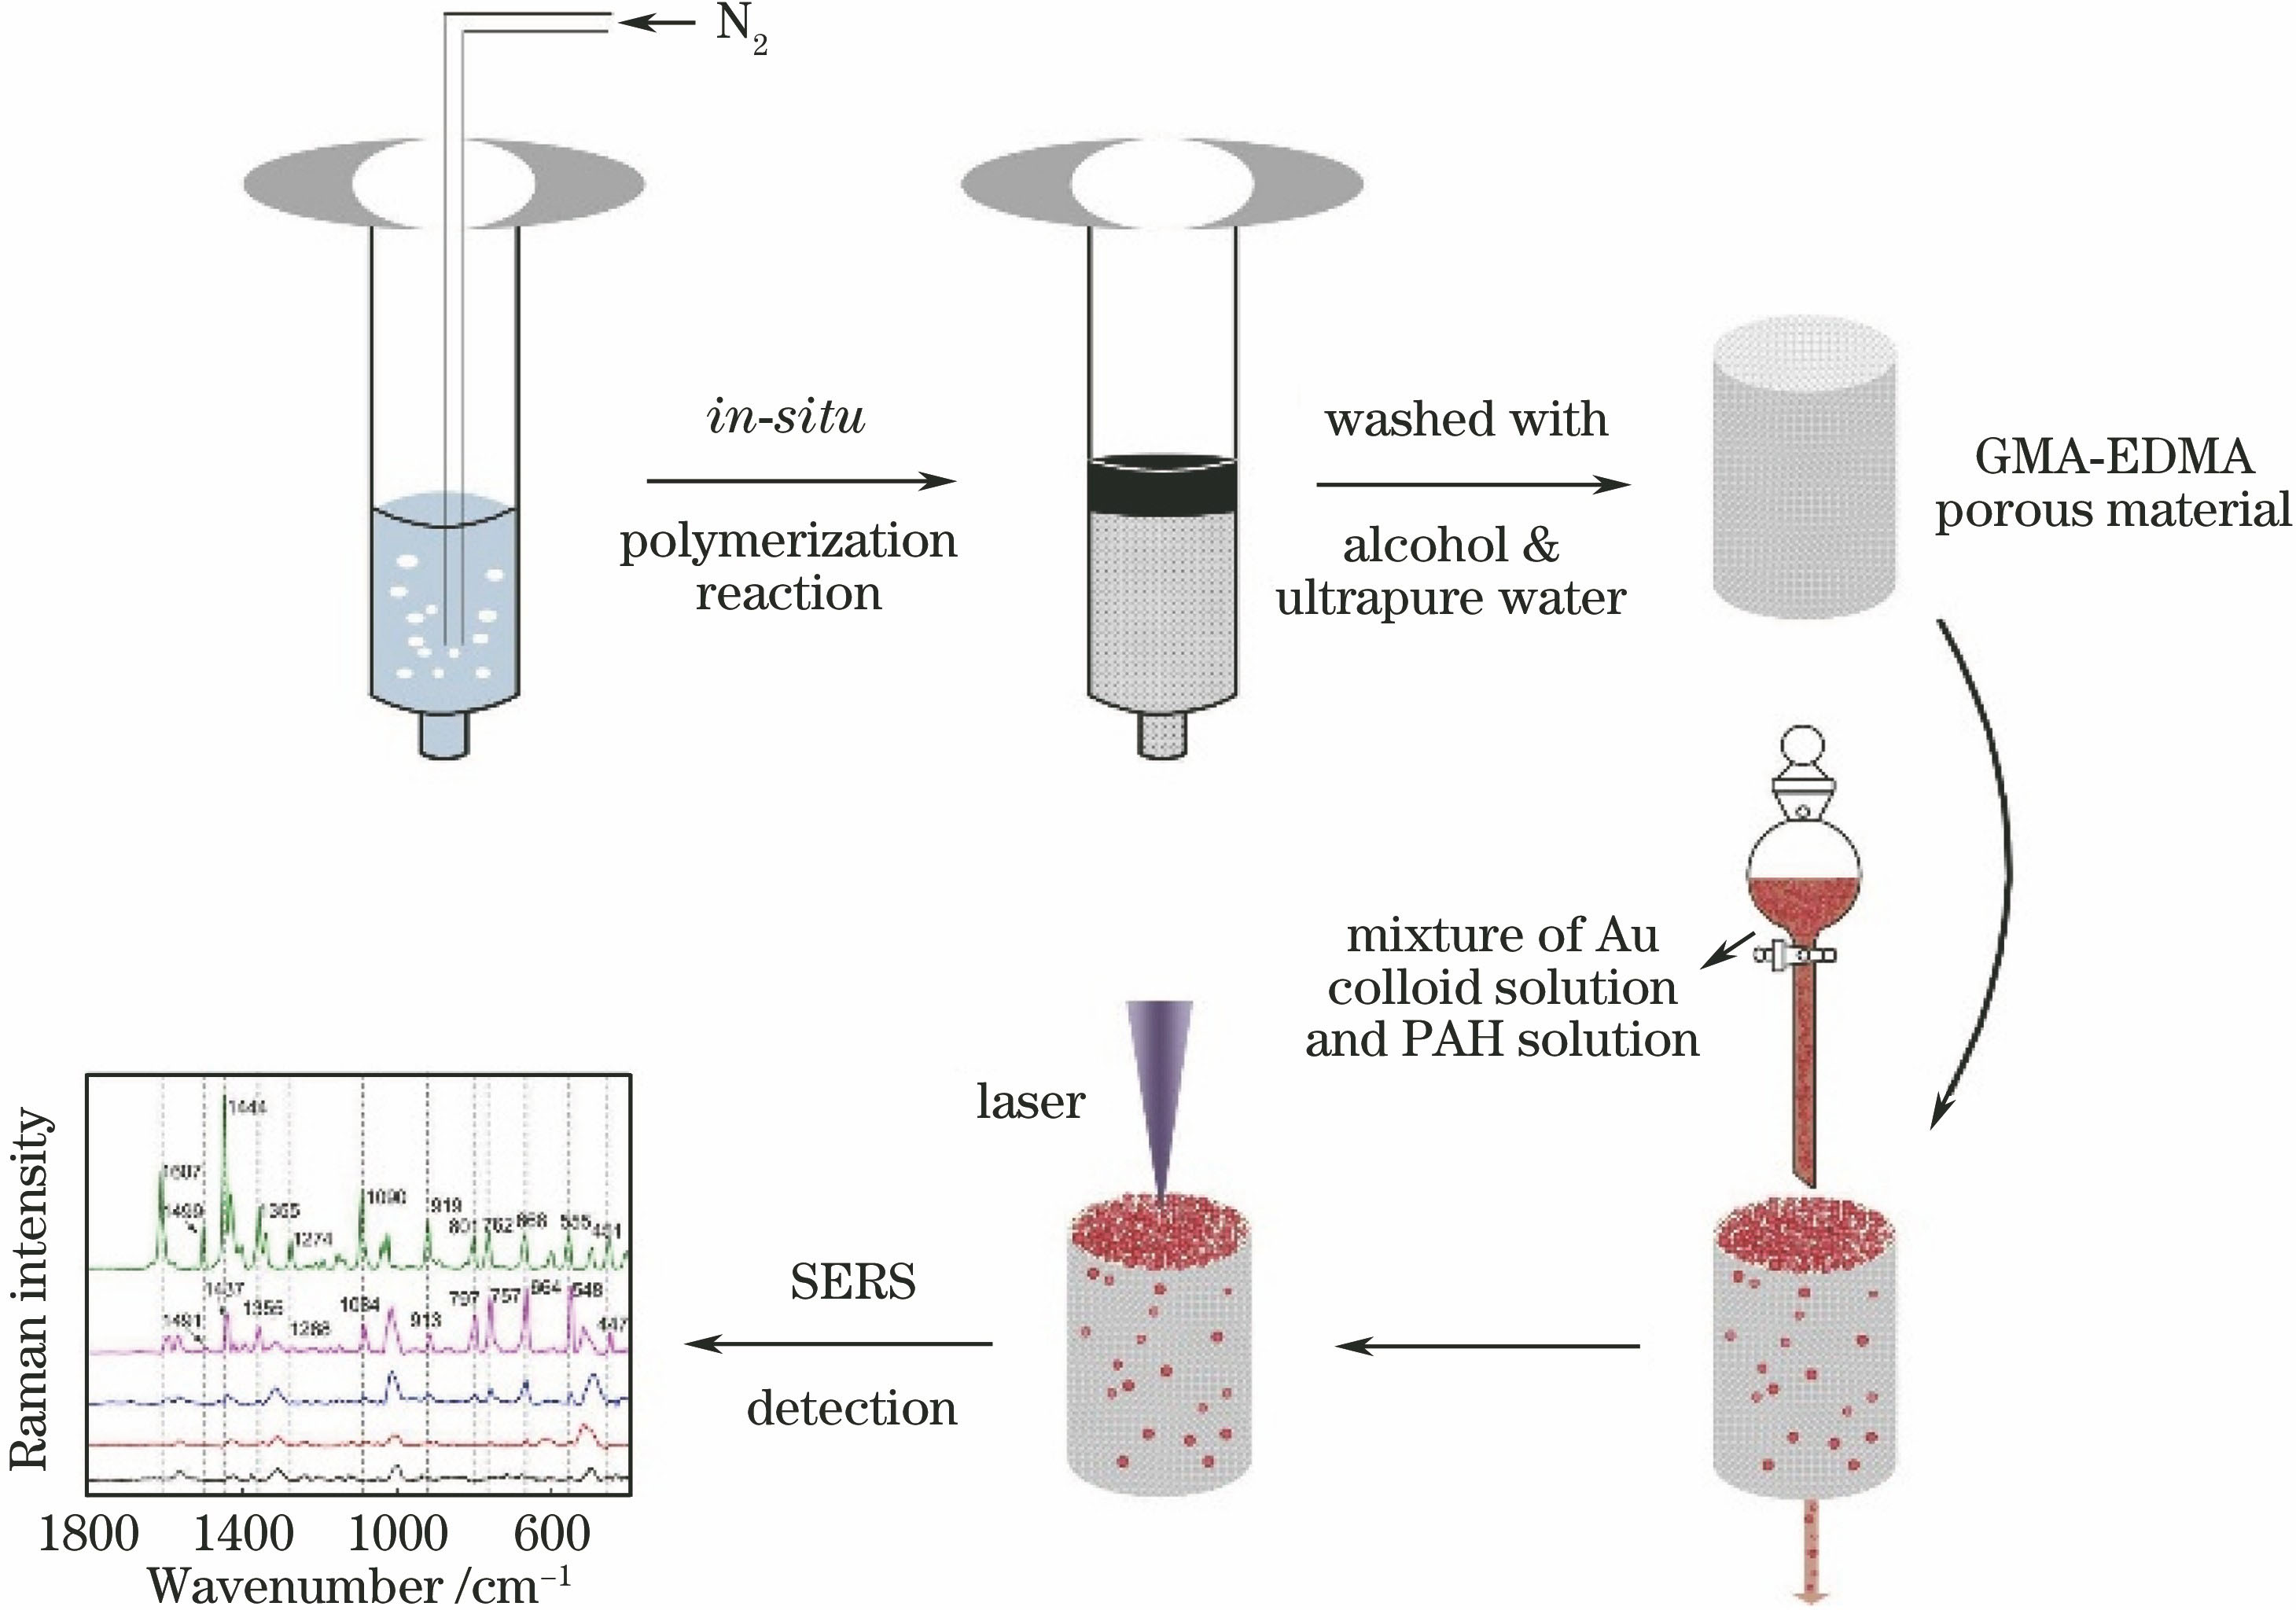
    Fig. 2. Flow chart of preparation of 3D SERS substrates and spectra collection of SERS
    SEM images of 3D SERS substrates. (a) Blank GMA-EDMA porous material; (b) Au-nanoparticle-absorbed GMA-EDMA porous material
    Fig. 3. SEM images of 3D SERS substrates. (a) Blank GMA-EDMA porous material; (b) Au-nanoparticle-absorbed GMA-EDMA porous material
    SERS spectra of pyrene solution (1×10⁻⁷ mol·L-1) obtained with two different substrates
    Fig. 4. SERS spectra of pyrene solution (1×10⁻⁷ mol·L-1) obtained with two different substrates
    Raman spectra of solid phenanthrene and SERS spectra of phenanthrene solutions with different concentrations
    Fig. 5. Raman spectra of solid phenanthrene and SERS spectra of phenanthrene solutions with different concentrations
    Relationship between Raman intensity at 707 cm-1 and 1351 cm-1 and concentration of phenanthrene solution
    Fig. 6. Relationship between Raman intensity at 707 cm-1 and 1351 cm-1 and concentration of phenanthrene solution
    Raman spectra of solid pyrene and SERS spectra of pyrene solutions with different concentrations
    Fig. 7. Raman spectra of solid pyrene and SERS spectra of pyrene solutions with different concentrations
    Relationship between Raman intensity at 590 cm-1 and 1237 cm-1 and concentration of pyrene solution
    Fig. 8. Relationship between Raman intensity at 590 cm-1 and 1237 cm-1 and concentration of pyrene solution
    SERS spectra of benzo(k) fluoranthene solutions with different concentrations and Raman spectra of solid benzo(k) fluoranthene
    Fig. 9. SERS spectra of benzo(k) fluoranthene solutions with different concentrations and Raman spectra of solid benzo(k) fluoranthene
    Relationship between Raman intensity at 548 cm-1 and 664 cm-1 and concentration of benzo(k) fluoranthene
    Fig. 10. Relationship between Raman intensity at 548 cm-1 and 664 cm-1 and concentration of benzo(k) fluoranthene
    SERS spectra of benzo(k) fluoranthene, pyrene, phenanthrene with same concentration of 1×10⁻⁸ mol·L-1 and mixture of these three substances
    Fig. 11. SERS spectra of benzo(k) fluoranthene, pyrene, phenanthrene with same concentration of 1×10⁻⁸ mol·L-1 and mixture of these three substances
    PAHRaman band /cm-1Mode
    Phenanthrene40654470710351200124013511432C-C-C bendingC-C-C bendingC-C-C bendingC-C stretching,H-C-C bendingC-C stretching,H-C-C bendingH-C-C bendingC-C stretching,H-C-C bendingC-C stretching,H-C-C bending
    Pyrene406590106012371400C-C-C bendingC-C-C bendingC-C stretching,C-H rockingC-C stretchingC-C stretching
    Benzo(k)fluoranthene548664757108413551437C-C-C bendingC-C-C bendingC-C-C bendingC-C stretchingC-C stretching,C-H rockingC-C stretching
    Table 1. Main Raman peak positions of phenanthrene, pyrene, and benzo(k) fluoranthene
    PAHRaman band/cm-1Regression equationCorrelation coefficient
    Phenanthrene7071351I=37.06C+3.15I=32.20C-25.890.9950.994
    Pyrene5901237I=144.29C+40.76I=65.88C+61.950.9920.988
    Benzo(k) fluoranthene548664I=33.45C+14.08I=45.70C+33.380.9920.982
    Table 2. Linear fitting equations and corresponding coefficients between Raman peak intensity and concentration of phenanthrene, pyrene, benzo(k) fluoranthene in the low concentration range
    Xiaofeng Shi, Xinmin Zhang, Xia Yan, Lizhen Ma, Xu Zhang, Haikuan Ma, Jun Ma. Detection of Polycyclic Aromatic Hydrocarbons (PAHs) in Water Based on Three-Dimensional Surface-Enhanced Raman Scattering Substrates[J]. Acta Optica Sinica, 2018, 38(7): 0724001
    Download Citation