
Cheng Cheng, Chengyu Shen. Optical Transmission Performance of Photonic Crystal Fiber Doped with Near-Infrared PbS Quantum Dots[J]. Acta Optica Sinica, 2019, 39(5): 0506006
- Acta Optica Sinica
- Vol. 39, Issue 5, 0506006 (2019)
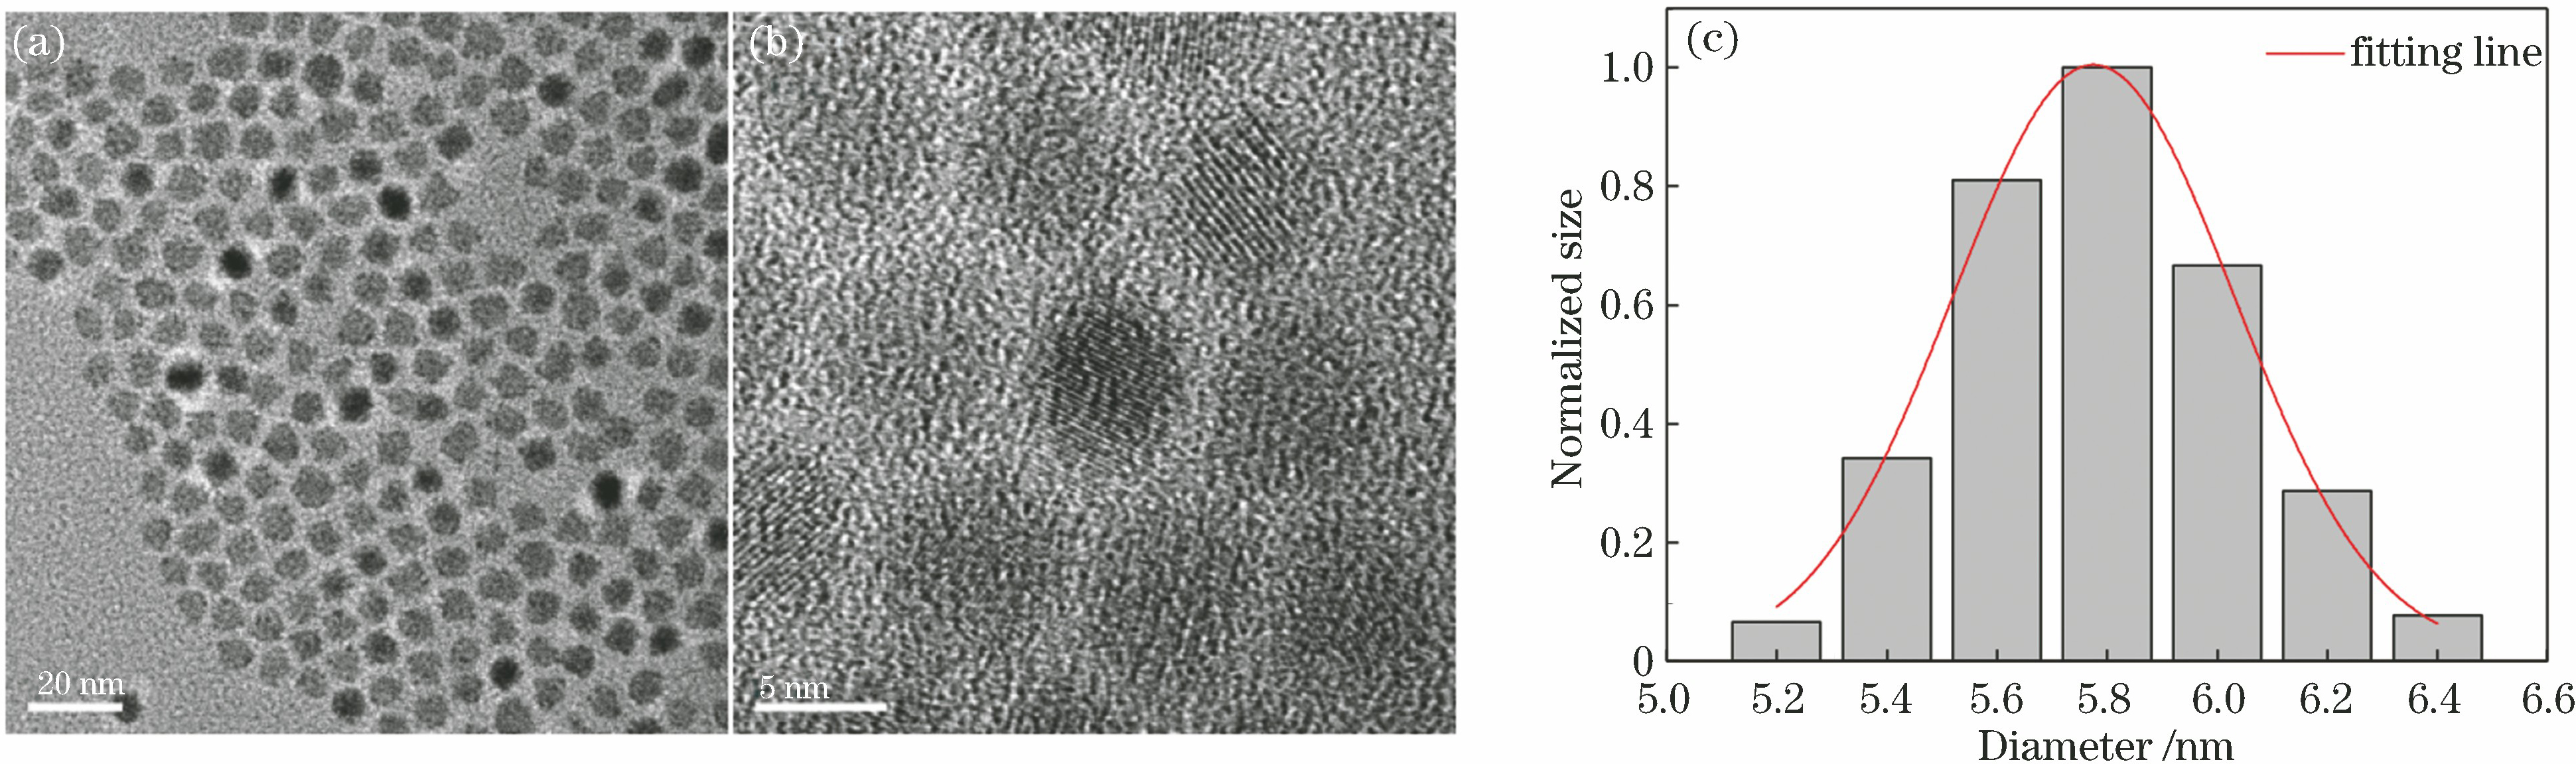
Fig. 1. TEM images and size distribution of PbS QDs. (a) TEM image of PbS QDs (20 nm scale); (b) TEM image of PbS QDs (5 nm scale); (c) size distribution of PbS QDs

Fig. 2. Cross-sectional diagram of PCF (provided by NKT Photonics, Denmark)
Fig. 3. QD-PCF contrast before and after volatilization of quantum dot solution. (a) QD-PCF filled with quantum dot solution; (b) QD-PCF after volatilization of solution
Fig. 4. Measured PL emission and absorption spectra of PbS QDs
Fig. 5. Measured optical power of QD-PCF varying with fiber length. (a) 980 nm pump light power; (b) 1550 nm signal light power
Fig. 6. PL-peak intensity of QD-PCF varying with fiber length for different doping concentrations
Fig. 7. PL spectra of QD-PCF and QDF. (a) PL spectra of QD-PCF; (b) comparison of PL spectra between QD-PCF and QDF
Fig. 8. Measured bandgap of QD-PCF (for 6.5 cm fiber length and 5 mg·mL-1 doping concentration)
Fig. 9. PL-peak intensity of QD-PCF varying with pump power

Set citation alerts for the article
Please enter your email address
© Copyright 2018-2021 | Chinese Laser Press. All Rights Reserved 沪ICP备15018463号-20