
Yue FENG, Lifang FENG, Jianli JIN, Shunyi HUANG. Adaptive Visible Light Location Algorithm Based on Region Division[J]. Acta Photonica Sinica, 2022, 51(3): 0306005
- Acta Photonica Sinica
- Vol. 51, Issue 3, 0306005 (2022)
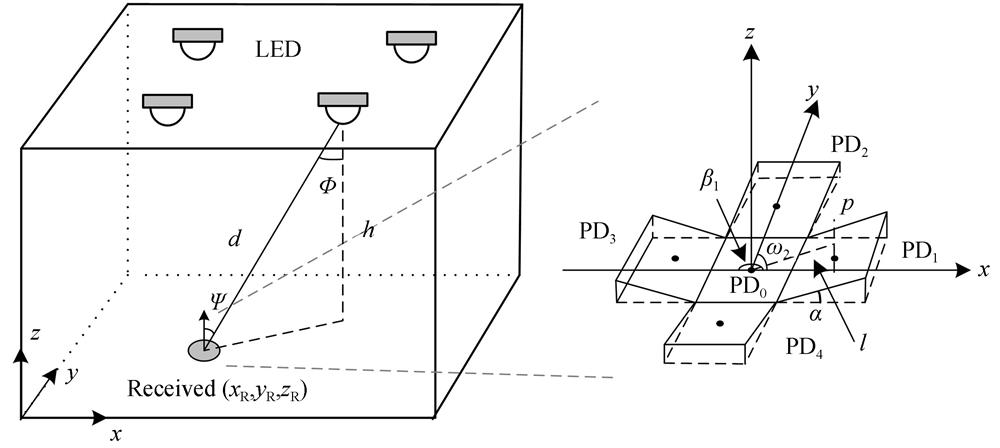
Fig. 1. Visible light positioning system model and receiver structure
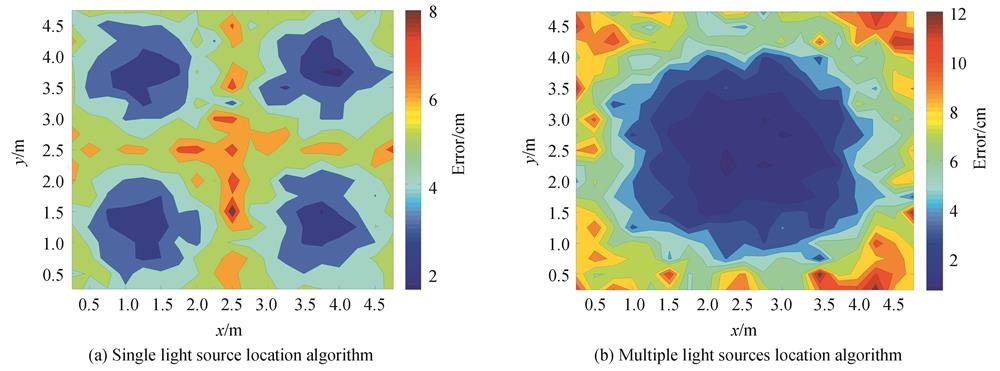
Fig. 2. Error distribution of two location algorithms
Fig. 3. Symmetry of two possible solutions in multiple lights scene
Fig. 4. Schematic diagram of auxiliary positioning
Fig. 5. Location error distribution of two light sources
Fig. 6. The change of positioning error with α
Fig. 7. Schematic diagram of regional division
Fig. 8. Distribution of indoor fairness function
Fig. 9. Influence of environmental parameters on positioning error
Fig. 10. Plane error distribution of adaptive localization algorithm
Fig. 11. Comparison of cumulative error distribution
Fig. 12. Positioning system model
Fig. 13. Experimental device
Fig. 14. Location error distribution of several algorithms in experimental environment
Fig. 15. Experimental results of adaptive localization algorithm
|
Table 1. Simulation parameters of indoor positioning system
|
Table 2. Comparison of positioning errors in different regions

Set citation alerts for the article
Please enter your email address
© Copyright 2018-2021 | Chinese Laser Press. All Rights Reserved 沪ICP备15018463号-20