• Chinese Optics Letters
  • Vol. 19, Issue 12, 123603 (2021)
Walid Aroua*
Author Affiliations
  • National Institute of Applied Sciences and Technology, Carthage University, 1080 Tunis, Tunisia
  • show less
    DOI: 10.3788/COL202119.123603 Cite this Article Set citation alerts
    Walid Aroua. Metallic nanoparticles/graphene-molecules hybrid system-based active biosensor[J]. Chinese Optics Letters, 2021, 19(12): 123603 Copy Citation Text show less

    Abstract

    The strong coupling between vibrational modes of molecules and surface plasmon resonance (SPR) modes in graphene makes them an ideal platform for biosensor techniques. In this paper, a new optical biosensor for molecule detection based on silver metallic nanoparticles (MNPs) and graphene/gold MNPs in a terahertz frequency range is achieved. It is established that the nonlinear electrical properties of graphene can play a major role in realizing a biosensor for molecule detection. The performance parameters of the proposed device are reported with respect to the chemical potential μ of graphene, noting that the sensitivity of our device passes from 255 nm/RIU (nanometers/refractive index unit) for μ=1.21 eV to 2753 nm/RIU for μ=0.21 eV. Finally, this structure exhibits an optical sensing region that can be adjusted to meet the requirements of optical detection.

    1. Introduction

    Now, the human life has a big challenge to fight against the pandemic provoked by a coronavirus (COVID-19); for this reason, research works in the biosensing field are very developed now. Starting by the definition of a biosensor, which is proposed by the International Union of Pure and Applied Chemistry (IUPAC) as “an electrochemical biosensor is a self-contained integrated device, which is capable of providing specific quantitative or semi-quantitative analytical information using a biological recognition element (biochemical receptor) which is retained in direct spatial contact with an electrochemical transduction element”[1], in this field, optical biosensor protocols are able to detect the smallest change in resonant frequency of light in the recognition element[24]. Up to now, several works have been implemented to achieve optical detection with important sensitivity (Se) and selectivity, including silicon avalanche light-emitting devices (Si Av LEDs)[5], electro optical modulators[6], nanophotonic structures[7], nonlinear materials[8], polymers, photonic crystal fibers, and electrochemical materials[912]. Note that biosensors are classified in a few categories depending on the application of the biosensor, for example, biosensors based on recognition material for DNA interactions[13], enzyme interaction[14,15], protein detection[16], toxic molecule interactions[17], and virus and bacterial interactions[1820]. The challenge now is to realize an optical biosensor for molecule detection in the nanometer (nm) scale sensitive to selected target; in light of this, nanobiosensors are developed by using recognition materials (receptor), which are integrated on the surface of the nanostructure[21]. We propose here to use the graphene superlattice as a recognition element for biological detection. It is demonstrated that graphene plays a factor in molecule detection because strong plasmonic field modes[22] generated at its surface are able to interact with resonant modes of molecules to be detected when placed near graphene nanomaterials. In this work, in order to increase the interaction of external light/surface plasmons (SPs), we introduce two parallel linear chains of silver (Ag) and gold (Au) metallic nanoparticles (MNPs), where the distance (h) between them is optimized in order to get a very good interaction. For the proposed devices, the two parallel chains play the role of electrodes, where the Ag chain is the input of the biosensor, and the output is placed at the end of the Au chain of nanoparticles. We notice that when using the nonlinear conductivity of graphene, a very high interaction between chains is obtained via the graphene-molecule system. Its higher selectivity and Se and our proposed optical biosensor are able to detect the quantities and nature of molecules present near the graphene sheet.

    2. Design of the Proposed Biosensor

    The demand for realization of an optical biosensor for molecule detection is becoming an urgent need to be satisfied to meet the direct real time and free detection of many viruses and biological and chemical substances. It is worth noting that a biosensor in the nm scale based on graphene/MNPs material is a device incorporating a biological sensing element used for the production of the concentration/nature of molecules proportional to measured signals[23]. In this paper, an innovative design of a biosensor based on localized SP (LSP)/SP/LSP interaction is depicted in Fig. 1. The proposed design employs MNPs organized in two parallel linearly arrayed chains incorporated in a single layer of graphene sheets freely suspended in vacuum. This membrane is only one atom thick and still displays a long-range crystalline order[24]. The first and second chains, (A) and (B), are formed by five Ag and Au metallic nanospheres, respectively, which play the role of nanoelectrodes. Compared with conventional macroscale electrodes, nanoelectrodes offer many advantages that arise from their limited size. Self-assembled chains of metal nanoparticles, in particular, have drawn interest for fabrication of nanoelectrodes because of their unique electrical and optical properties and geometric morphology. For this particular linear geometry of MNPs, the particles interact together, forming an SPR mode able to propagate without the loss used for optical detection and optical transistors[25,26].

    Schematic of the studied optical device based on the Ag MNPs chain-graphene-Au MNPs chain, where vibrational molecules are placed on the surface of graphene lattice. The nanoelectrodes of our device formed by two parallel linear chains of (A) Ag MNPs and (B) Au MNPs are separated by a distance (h) and incorporated in a suspended graphene single layer. We shine only the Ag chain (A) by an external light beam, and the output detector is placed at the end of the Au chain (B).

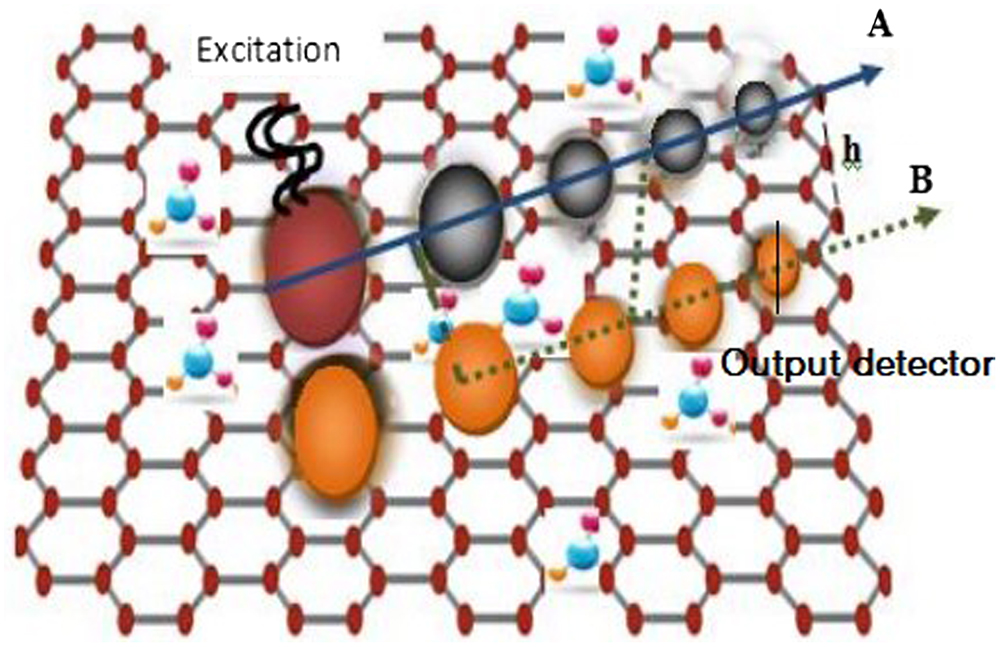
    Figure 1.Schematic of the studied optical device based on the Ag MNPs chain-graphene-Au MNPs chain, where vibrational molecules are placed on the surface of graphene lattice. The nanoelectrodes of our device formed by two parallel linear chains of (A) Ag MNPs and (B) Au MNPs are separated by a distance (h) and incorporated in a suspended graphene single layer. We shine only the Ag chain (A) by an external light beam, and the output detector is placed at the end of the Au chain (B).

    In practice, the optical response of the Ag/Au-MNPs-loaded graphene sheet was measured by injecting a polarized laser light at the Ag MNPs entrance chain (A). In order to control the incident beam to hit only the Ag chain, a spot size converter device (SSC) with an output signal around 80 nm can be used to couple the laser polarized light to the entrance facet of Ag MNPs. The light at the end of the Au MNPs chain was collected by an objective and focused onto a power meter. Ag MNPs have great potential in a broad range of applications, such as in biomedical device coatings. It is expected that Ag nanoparticles can be easily prevented from oxidation by providing suitable surfactant as a protection barrier[27]. The radius of MNPs varies from 75 nm to 55 nm by steps of 5 nm. The spacing distance between MNPs is fixed around 5 nm in order to select the resonant frequency of propagation of the LSP modes generated at the surface of MNPs through the chain that is able to overlap with SPs generated at the surface of the single graphene layer. The optical response of the MNPs is controlled via their permittivity, which is given by the Drude model: ε(ω)=1ωp2ω2+iωγ,where ω and γ are the plasma frequency and the damping factor for Ag and Au metals, respectively, which are arranged in Table 1[28].

    As mentioned above, precise control over the geometry of these nanoparticles is nontrivial, and ion beam shaping is a new method used to engineer nanocomposites with effective three-dimensional (3D) architectures. In particular, this technique offers the possibility to precisely control the size, shape, and 3D orientation of MNPs at the nm scale placed at the vicinity of a graphene sheet[29].

     AgAu
    ωp (Hz)13.7×10161.3×1014
    γ (Hz)1.64×10166.3×1012

    Table 1. Plasma Frequency ωp and Damping Factor γ for Ag and Au Metals

    3. Results and Discussion

    3.1. Electrical and optical properties of graphene-molecules hybrid system

    We propose to take advantage of the electrical properties of graphene, so the proposed nanospheres are incorporated in a graphene lattice, which is considered a receptor of our biosensor, where the vibrational molecules to be detected are placed in its vicinity. Graphene is a 2D sheet of carbons with an atomic thickness that exhibits very important electrical, optical, and thermal properties. It contains free carriers (electrons) with high mobility. Despite being only one atom thick, graphene absorbs a significant fraction of light, so there is very important coupling with detected molecules. The dispersion relation of graphene shows that graphene can be considered as a semi-conductor with zero gap, which is because graphene is able to generate SP modes like metals propagating with high speed. Here, all electrical properties of graphene are summarized in its conductivity σ, which is given by[30]σ=e24(12+1πarctan(ω2μ2KBT)i2πln((ω+2μ)2(ω2μ)2+(2KBT)2))+2ie2KBTπ2(ω+iτ)ln(2cosh(μ2KBT))i9vf2e48μπ2ω3|E|2,where ω denotes the photon energy of the probe beam, vfC300 is the Fermi velocity, T=300K is the temperature of graphene, e is the electron charge, μ is the chemical potential, KB is the Boltzmann constant, E is the amplitude of the electric field at the surface of the graphene layer, and τ=10ps is scattering time. The optical properties of graphene can be established via the electric permittivity, ε, given by ε=1+iσε0ωd,where d=0.33nm is the thickness of the single graphene sheet, and ε0 is the vacuum permittivity. In order to discuss the effect of the presence of the vibrational modes of different molecules near the graphene surface, we performed a study of the transmission coefficient (T) dependence on the frequency of the incident beam. It is worth noting that the collective plasmon resonance modes are responsible for the peak in the transmission spectrum. It is obvious that the SP generates a strong near field that can be exploited to detect the vibrational modes of molecules placed near the surface. From the research work published by Zundel et al.[31] in the presence of the analyzed molecules and neglecting the rest of the resonant modes of molecules, the new permittivity of the graphene-molecules hybrid system becomes εhs=ε+iε=ε+δε,where δε is given by the following equation: δε=12αmS34παmS,where S is the concentration of the molecules near the graphene material, and αm is their polarizability that is given by αm=β(ωm)2(ω)2i2ωγm,where ωm is the single vibrational mode of the molecule, γm=0.5meV is the half-width, and β=10meV2 is the polarizability strength of the analyzed molecule. In order to understand the optical properties of our hybrid system, we present in Figs. 2(a) and 2(b) the variation of the real part of its permittivity ε as a function of the frequency of the external beam for different concentration of molecules S.

    Variation of the real part of the permittivity of the graphene-molecules hybrid system for molecule concentrations S = 0 nm−3, S = 0.01 nm−3, and S = 0.014 nm−3, where the chemical potential of graphene is μ = 0.21 eV. (a) ℏωm = 280 meV and (b) ℏωm = 284 meV.

    Figure 2.Variation of the real part of the permittivity of the graphene-molecules hybrid system for molecule concentrations S = 0 nm−3, S = 0.01 nm−3, and S = 0.014 nm−3, where the chemical potential of graphene is μ = 0.21 eV. (a) ℏωm = 280 meV and (b) ℏωm = 284 meV.

    For the two selected molecules that are characterized by ωm around 280 meV [Fig. 2(a)] and 284 meV [Fig. 2(b)], we can see that for large value of S the effect of molecules increases, so a large difference between the permittivity of graphene only (red line) and the permittivity of the hybrid system (blue line, black line) is obtained. This difference is essentially due to the important overlap between the SP modes of graphene and the vibrational modes of molecules. In this context, we particularly assume that the proposed biosensor is able to detect the variation of concentration of molecules. Compared to Fig. 2(b), in Fig. 2(a) and for S=0.014nm3, for example, we observe a peak (blue line) of permittivity near the singularity of the conductivity of graphene. By increasing ωm to 284 meV [see Fig. 2(b)], a red shift is obtained. Therefore, our device is also able to detect the nature of the molecule placed near the graphene layer.

    3.2. Performance of the LSP/SP/LSP biosensor

    Let us investigate firstly where only the Ag chain (A) is incorporated in graphene. Using the point dipole approximation, the generation of the LSPs in the Ag chain can be modeled via the dipole-dipole interaction (DDI). Here, the involved induced dipole is calculated using the iterative equation: Pi=αiEi+αiGijPj,where αi is the polarizability of the Ag MNPs, Ei is the electric field component of the source beam, which is equal to Ei=E0eiωt, Pj is the induced dipole of the j(eme) metallic ball, which is excited by the i(eme) ball, and Gij is the interaction Green’s function between MNPs calculated by the following: Gij=(k2+εhs1)e(ik|rirj|)|rirj|.

    Here, εhs is the permittivity of the graphene-molecule hybrid system given by Eq. (3), k=ωcεhs is the wave number, and ri and rj are the positions of particle number i and particle number j in the Ag chain, respectively. Noting that for the graphene layer the propagation of the SP mode is controlled by the Kerr effect phenomenon[32,33]. Therefore, in order to get a strong coupling between LSP modes in MNPs and SP modes in graphene, the induced dipole momentum in the chain was corrected by the nonlinear contribution process. So, the expression of the induced dipole of Ag MNPs becomes P(ω)=Pl(ω)+Pnl(ω),where Pl(ω) and Pnl(ω) are the linear and the nonlinear polarizations of Ag MNPs, in which, the third nonlinearity of the induced dipole Pnl(ω) can be written as Pnl(ω)=εhsχ3|Eω||Eω|2,where χ3 is the third susceptibility of Ag MNPs[31], equal to 1016m2V2.

    Combining Eqs. (6), (8) and (9), the polarization in i(eme) Ag MNPs becomes Pi(ω:ω,ω,ω)=αiEi(ω)+εhsχ3|Ei(ω)||Ei(ω)|2+αiGijPj.

    Now, in order to discuss the effect of the chemical potential μ of graphene on the coupling of Ag MNPs-graphene/molecules, in this paper, we have calculated the transmission coefficient (T) at the end of the chain via determination of the emitted electric field at the end of the chain that is equal to Eend=k2εhsGijPend,where Pend is the dipole momentum of the rightmost particle done by Eq. (10), and Gij is Green’s function between the position of the dipole (Pend) and the detector. So, the transmission coefficient T can be calculated via the equation T=|Eend|2|Ei|2. For a molecule concentration S=0.01nm3, we present in Figs. 3 and 4 the transmission coefficient T at the end of the Ag MNPs chain for μ=0.21eV and μ=1.21eV, respectively.

    Transmission coefficient (T) as a function of frequency for the three selected molecules that are characterized by ℏωm = 280 meV, ℏωm = 284 meV, and ℏωm = 288 meV, respectively. The chemical potential of the graphene layer is equal to 0.21 eV at room temperature.

    Figure 3.Transmission coefficient (T) as a function of frequency for the three selected molecules that are characterized by ℏωm = 280 meV, ℏωm = 284 meV, and ℏωm = 288 meV, respectively. The chemical potential of the graphene layer is equal to 0.21 eV at room temperature.

    Transmission coefficient (T) as a function of frequency for the three selected molecules characterized by ℏωm = 280 meV, ℏωm = 284 meV, and ℏωm = 288 meV, respectively. The chemical potential of the graphene layer is equal to 1.21 eV at room temperature.

    Figure 4.Transmission coefficient (T) as a function of frequency for the three selected molecules characterized by ℏωm = 280 meV, ℏωm = 284 meV, and ℏωm = 288 meV, respectively. The chemical potential of the graphene layer is equal to 1.21 eV at room temperature.

    As mentioned above, we found that the origin of the variation in the transmission spectra is mainly coming from the presence of the molecules that affect the density of defect in the graphene superlattice. Generally, the presence of molecules changes the figures of merit (FOMs) of devices, such as carrier mobility and conductivity[34], so a variation of the permittivity εhs of the medium surrounded by Ag MNPs is obtained. In Fig. 3, we observe a peak in the transmission spectra located at 3.2×10¹⁴Hz. As we can see, the position of this peak is independent of the value of ωm, and only its amplitude changes with ωm. Whereas, in the frequency range between 2.9×10¹⁴Hz and 3.2×10¹⁴Hz, a redshift as a function of the value of ωm of molecules is achieved. Noting that, this peak widens dramatically in Fig. 4, where the chemical potential is around 1.21 eV. It is shown that, for ωm=280meV, the peak of the transmission coefficient (T) is located at 2.5×10¹⁴Hz, and, by increasing ωm to 284 nm, the peak shifts to 2.8×10¹⁴Hz. The performance of our device is controlled by calculating the sensitivity (Se) given by Se=δλδngm, with ngm representing the refractive index of the graphene-molecules system. For the proposed device, the Se of the LSP/SP structure is equal to 825 nm/ RIU for μ = 0.21 eV. Increasing the chemical potential μ of graphene to 1.2 eV, the Se and the FOM [defined as the ratio of the Se and the full width at half-maximum (FWHM) of the peak] of the biosensor decrease to 492 nm/RIU and 63.22RIU1, respectively. On the other hand, the variation of the amplitude of the transmission peak observed in Fig. 4 should be due to the augmentation of the absorption of light in the graphene-molecules system because a very large match between graphene and vibrational modes of molecules is achieved for μ=1.2eV. We conclude that the chemical potential of graphene affects the selectivity of the proposed biosensor by changing the propagation process in graphene, where it is controlled by the Kerr effect process essentially for ω<μ. In order to get an idea about the optical time response of our biosensor, from Figs. 3 and 4, we calculate numerically the rise time τr via the equation τr0.35f3dB with f3dB as the measured bandwidth of our biosensor. It is established that, for a chemical potential μ=0.21eV and ω=288meV, the rise time is around 5 ps and increases to 9 ps for ω=280meV compared to μ=1.21eV, where the rise time τr can be considered constant for the three selected molecules and reaches around 3 ps. Now, by incorporating a second linear chain of Au MNPs parallel to the Ag MNPs chain in the graphene-molecules system, we discuss the optical response of our proposed biosensor. Here, the Au metal is characterized by the plasma frequency ωp=1.64×10¹⁶Hz and the damping factor γ=6.3×10¹²Hz. The third nonlinear susceptibility of Au MNPs is fixed around χ3=(1.4+7i)1016m2V2. The chain (B) is incorporated at a distance (h) from the first Ag MNPs chain (A) (see Fig. 1). As mentioned above, all of chain (B) can only scatter second waves from chain (A) via the hybrid system. Here, the induced dipole in the Au MNPs chain is calculated using the equation Pi(ω:ω,ω,ω)=εhsχ3|EA(ω)||EA(ω)|2+αi(Gij+Gint)Pj,where αi is the polarizability of Au MNPs, Gij describes the interaction between different Au MNPs, Gint represents Green’s tensor that was introduced in order to take into account the interaction between the Ag and Au particles, and EA(ω) is the emitted electric field by the chain (A) at a distance (h) given by Eq. (11) via the hybrid system. The emitted electric field at the output of our device is calculated using the equation Eout=k2εhsGijPout, where Pout is the dipole moment of the rightmost (Au) particle. Hence, it is possible to note that Gint has the same expression as Gij, except we replaced |rirj| by the separating distance (h). Finally, the transmission coefficient at the output of our biosensor is given by T=|Eout|2|Ei|2.

    For graphene at room temperature, it is clearly noticeable from Fig. 5 that the presence of the molecules near the graphene surface strongly affects the transmission in the Au MNPs chain. As shown in Fig. 5 with ωm=280meV of molecules, we observe three peaks located at 1014Hz, 1.4×10¹⁴Hz, and 2.8×10¹⁴Hz, respectively, where the last one is due to the resonance modes of molecules, while the first and second peaks are due to the nonlinear Kerr effect in the graphene sheet. In order to understand the effect of the presence of the second chain (B), we performed a study of the transmission coefficient dependence on the separation distance (h) between electrodes with and without molecules essential for μ=1.21eV. However, values of μ below 0.45 eV still produce noticeable changes in the absorption spectrum in graphene, so an important coupling between graphene and the molecules is obtained. We notice from Fig. 6 that the variations of (h) from 100 nm to 250 nm do not strongly affect the coupling efficiency between chains with and without molecules due essentially to the important propagation of light in the graphene sheet. It is noticeable from Fig. 6 that an augmentation in the amplitude of the transmission efficiency accompanied with a smaller shift of resonance frequency in the low frequency range is achieved.

    Transmission spectra calculated at the end of chain (B) with and without molecules, and the chemical potential of graphene is μ = 1.21 eV.

    Figure 5.Transmission spectra calculated at the end of chain (B) with and without molecules, and the chemical potential of graphene is μ = 1.21 eV.

    Transmission spectra for different value of h when ωm = 280 meV and μ = 1.21 eV.

    Figure 6.Transmission spectra for different value of h when ωm = 280 meV and μ = 1.21 eV.

    It is worth noting that molecule detection is controlled by the nonlinear conductivity of graphene, so, by activating the graphene monolayer (i.e., varying chemical potential μ from 0.21 eV to 1.21 eV), we can detect the presence or select the nature of molecules and stop or allow the propagation of light in the second chain. The transmission spectrum through the second chain (B) is plotted in Fig. 7 for the two values of the chemical potential 0.21 eV and 1.21 eV. We notice that for h=150nm and ωm=284meV the transmission of light is blocked if μ is equal to 1.21 eV, where light is stopped in the graphene sheet, and the maximum of transmission efficiency is about T=0.0018 (a.u.). Decreasing μ to 0.21 eV, the transmission efficiency increases to 0.15 (a.u.) in the Au linear chain.

    Transmission spectrum of light passing through the second chain (B) for the two values of the chemical potential μ = 0.21 eV and μ = 1.21 eV.

    Figure 7.Transmission spectrum of light passing through the second chain (B) for the two values of the chemical potential μ = 0.21 eV and μ = 1.21 eV.

    In Figs. 8(a) and 8(b), we plot the absorption spectra of the graphene-molecules system, which is calculated via the equation Ag=1T1T2, where T1 and T2 are the values of the transmission efficiency in the first and second chains, respectively, for μ=0.21eV. We notice that for the two selected molecules, which are characterized by ωm=280meV and ωm=284meV, respectively, the amplitude of the absorbed light is around 0.5 (a.u), while the half-width of the absorption spectrum is about 0.4×10¹⁴Hz and decreases for ωm=284meV to 0.3×10¹⁴Hz. In order to study the performance of the biosensor, the effect of μ in the Se of the LSP-SPP-LSP biosensor is achieved in this work, and we notice that for μ=0.21eV the Se is equal to 2765 nm/RIU and decreases to 255 nm/RIU for μ=1.21eV. Compared to the LSP-SP biosensor, where only the Ag MNPs are incorporated in graphene, the Se is 825 nm/RIU. Note that by adding a second chain of MNPs, and for μ=1.21eV, the Se decreases. In addition, from Figs. 8(a) and 8(b), we conclude that the selectivity of our device increases by stopping/allowing light to attend the output of our biosensor by changing the nature of the molecules. The reason is that with ωm=284meV a weak coupling between electrodes is achieved, where the LSP cannot propagate through the Au chain of MNPs.

    Variation of the absorption in graphene (red line), transmission of light passing through Ag chain (red dashed line), and transmission at the end of the Au chain (black line) for (a) ℏωm = 280 meV and (b) ℏωm = 284 meV when the chemical potential μ = 0.21 eV.

    Figure 8.Variation of the absorption in graphene (red line), transmission of light passing through Ag chain (red dashed line), and transmission at the end of the Au chain (black line) for (a) ℏωm = 280 meV and (b) ℏωm = 284 meV when the chemical potential μ = 0.21 eV.

    4. Conclusion

    The coupling LSP-SPP-LSP modes at the nanoscales are achieved in order to realize a nanobiosensor device based on Ag MNPs-graphene-Au MNPs. In this work, we demonstrate that the nonlinear properties of the graphene sheet could play a major role in realizing a biosensor for molecule detection. It is established that the chemical potential μ of graphene is a major factor for controlling light in graphene. We have shown that for μ=0.21eV our device can be used for detection of vibrational modes in molecules. By increasing μ to 1.21 eV, we can stop light attending the end of the device. Here, the Se of the LSP-SPP-LSP device is around 2765 nm/RIU. By adding a second linear chain of Au metal, light can be stopped in graphene or allowed to pass through the second chain depending on the nature of the detected molecules. From this paper, we conclude that the proposed structure exhibits an optical sensing region that can be adjusted to meet the requirements for designing an optical biosensor that operates at room temperature for molecule detection.

    References

    [1] D. R. Thévenot, K. Toth, R. A. Durst, G. S. Wilson. Electrochemical biosensors: recommended definitions and classification. Biosens. Bioelectron., 16, 121(2001).

    [2] P. Damborský, J. Švitel, J. Katrlík. Optical biosensors. Essays Biochem., 60, 91(2016).

    [3] S. M. Yoo, S. Y. Lee. Optical biosensors for the detection of pathogenic microorganisms. Trends Biotechnol., 34, 7(2016).

    [4] C. Chen, J. Wang. Optical biosensors: an exhaustive and comprehensive review. Analyst, 145, 1605(2020).

    [5] K. Xu, Y. Chen, T. A. Okhai, L. W. Snyman. Micro optical sensors based on avalanching silicon light-emitting devices monolithically integrated on chips. Opt. Mater. Express, 9, 3985(2019).

    [6] K. Xu. Silicon electro-optic micro-modulator fabricated in standard CMOS technology as components for all silicon monolithic integrated optoelectronic systems. J. Micromech. Microeng., 31, 054001(2021).

    [7] M. Soler, O. Calvo-Lozano, M.-C. Estevez, L. M. Lechuga. Nanophotonic biosensors: driving personalized medicine. Opt. Photon. News, 31, 4(2020).

    [8] M. Mesch, B. Metzger, M. Hentschel, H. Giessen. Nonlinear plasmonic sensing. Nano Lett., 16, 3155(2016).

    [9] G. Emir, Y. Dilgin, A. Ramanaviciene, A. Ramanavicius. Amperometric nonenzymatic glucose biosensor based on graphite rod electrode modified by Ni-nanoparticle/polypyrrole composite. Microchem. J., 161, 105751(2021).

    [10] Y. Zhou, A. Marar, P. Kner, R. P. Ramasamy. Charge-directed immobilization of bacteriophage on nanostructured electrode for whole-cell electrochemical biosensors. Anal. Chem., 89, 5734(2017).

    [11] A. B. Socorro-Leránoz, D. Santano, I. Del Villar, I. R. Matias. Trends in the design of wavelength-based optical fibre biosensors (2008–2018). Biosens. Bioelectron. X, 1, 100015(2019).

    [12] D. T. Hoa, T. N. Suresh Kumar, N. S. Punekar, R. S. Srinivasa, R. Lal, A. Q. Contractor. Biosensor based on conducting polymers. Anal. Chem., 64, 2645(1992).

    [13] E. A. Chiticaru, L. Pilan, C. M. Damian, E. Vasile, J. S. Burns, M. Ioniţă. Influence of graphene oxide concentration when fabricating an electrochemical biosensor for DNA detection. Biosensors, 9, 113(2019).

    [14] J. Peña-Bahamonde, H. N. Nguyen, S. K. Fanourakis. Recent advances in graphene-based biosensor technology with applications in life sciences. J. Nanobiotechnol., 16, 75(2018).

    [15] S. Liu, Z. Yang, Y. Chang, Y. Chai, R. Yuan. An enzyme-free electrochemical biosensor combining target recycling with Fe3O4/CeO2 Au nanocatalysts for microRNA-21 detection. Biosens. Bioelectron., 119, 170(2018).

    [16] C. Liu, X. Zeng, Z. An, Y. Yang, Y. Yang, M. Eisenbaum, X. Gu, J. M. Jornet, G. K. Dy, M. E. Reid, Q. Gan, Y. Wu. Sensitive detection of exosomal proteins via a compact surface plasmon resonance biosensor for cancer diagnosis. ACS Sens., 3, 1471(2018).

    [17] Y. Yi, B. Xie, T. Zhao, Z. Li, D. Stom, H. Liu. Effect of external resistance on the sensitivity of microbial fuel cell biosensor for detection of different types of pollutants. Bioelectrochemistry, 125, 71(2019).

    [18] S. Campuzano, P. Yáñez-Sedeño, J. M. Pingarrón. Molecular biosensors for electrochemical detection of infectious pathogens in liquid biopsies: current trends and challenges. Sensors, 17, 2533(2017).

    [19] M. Manzano, S. Viezzi, S. Mazerat, R. S. Marks, J. Vidic. Rapid and label-free electrochemical DNA biosensor for detecting hepatitis A virus. Biosens. Bioelectron., 100, 89(2018).

    [20] M. Manzano, S. Viezzi, S. Mazerat, R. S. Marks, J. Vidic. Rapid and label-free electrochemical DNA biosensor for detecting hepatitis A virus. Biosens. Bioelectron., 100, 89(2018).

    [21] H. V. Raghu, N. Dasgupta, T. Parkunan, S. Ranjan, N. Kumar, E. Lichtfouse. Application of nanobiosensors for food safety monitoring. Environmental Nanotechnology(2020).

    [22] L. Wu, H. S. Chu, W. S. Koh, E. P. Li. Highly sensitive graphene biosensors based on surface plasmon resonance. Opt. Express, 18, 14395(2010).

    [23] K. Saha, S. S. Agasti, C. Kim, X. Li, V. M. Rotello. Gold nanoparticles in chemical and biological sensing. Chem. Rev., 112, 2739(2012).

    [24] J. Meyer, A. Geim, M. Katsnelson. The structure of suspended graphene sheets. Nature, 446, 60(2007).

    [25] L. Pu, M. Baig, V. Maheshwari. Nanoparticle chains as electrochemical sensors and electrodes. Anal. Bioanal. Chem., 408, 2697(2016).

    [26] X. Zhao, L. Yang, J. Guo, T. Xiao, Y. Zhou, Y. Zhang, B. Tu, T. Li, B. A. Grzybowski, Y. Yan. Transistor and logic circuit based on metal nanoparticles and ionic gradients. Nat. Electron., 4, 109(2021).

    [27] S. H. Lee, B.-H. Jun. Silver nanoparticles: synthesis and application for nanomedicine. Int. J. Mol. Sci., 20, 865(2019).

    [28] L. J. Mendoza Herrera, D. M. Arboleda, D. C. Schinca, L. B. Scaffardi. Determination of plasma frequency, damping constant, and size distribution from the complex dielectric function of noble metal nanoparticles. J. Appl. Phys., 116, 233105(2014).

    [29] P. E. Coulon, J. Amici, M. C. Clochard. Ion-shaping of embedded gold hollow nanoshells into vertically aligned prolate morphologies. Sci. Rep., 6, 21116(2016).

    [30] Y. Gao, I. Shadrivov. Nonlinear coupling in graphene-coated nanowires. Sci. Rep., 6, 38924(2016).

    [31] L. Zundel, A. Manjavacas. Spatially resolved optical sensing using graphene nanodisk arrays. ACS Photon., 4, 1831(2017).

    [32] N. A. Savostianova, S. A. Mikhailov. Optical Kerr effect in graphene: theoretical analysis of the optical heterodyne detection technique. Phys. Rev. B, 97, 165424(2018).

    [33] S. Sumi, H. Awano, M. Hayashi. Interference induced enhancement of magneto-optical Kerr effect in ultrathin magnetic films. Sci. Rep., 8, 776(2018).

    [34] H. Nadjari, Z. Abasi Azad. Determining the nonlinear coefficient of gold and silver nano-colloids using SPM and CW Z-scan. Opt. Laser Technol., 44, 1629(2012).

    Walid Aroua. Metallic nanoparticles/graphene-molecules hybrid system-based active biosensor[J]. Chinese Optics Letters, 2021, 19(12): 123603
    Download Citation