
Jin Yang, Jun Chen Ke, Mao Chen, Ming Zheng Chen, Jun Yan Dai, Jian Feng Chen, Rui Yang, Jun Wei Wu, Qiang Cheng, Tie Jun Cui. Control of the harmonic near-field distributions by an active metasurface loaded with pin diodes[J]. Photonics Research, 2021, 9(3): 344
- Photonics Research
- Vol. 9, Issue 3, 344 (2021)
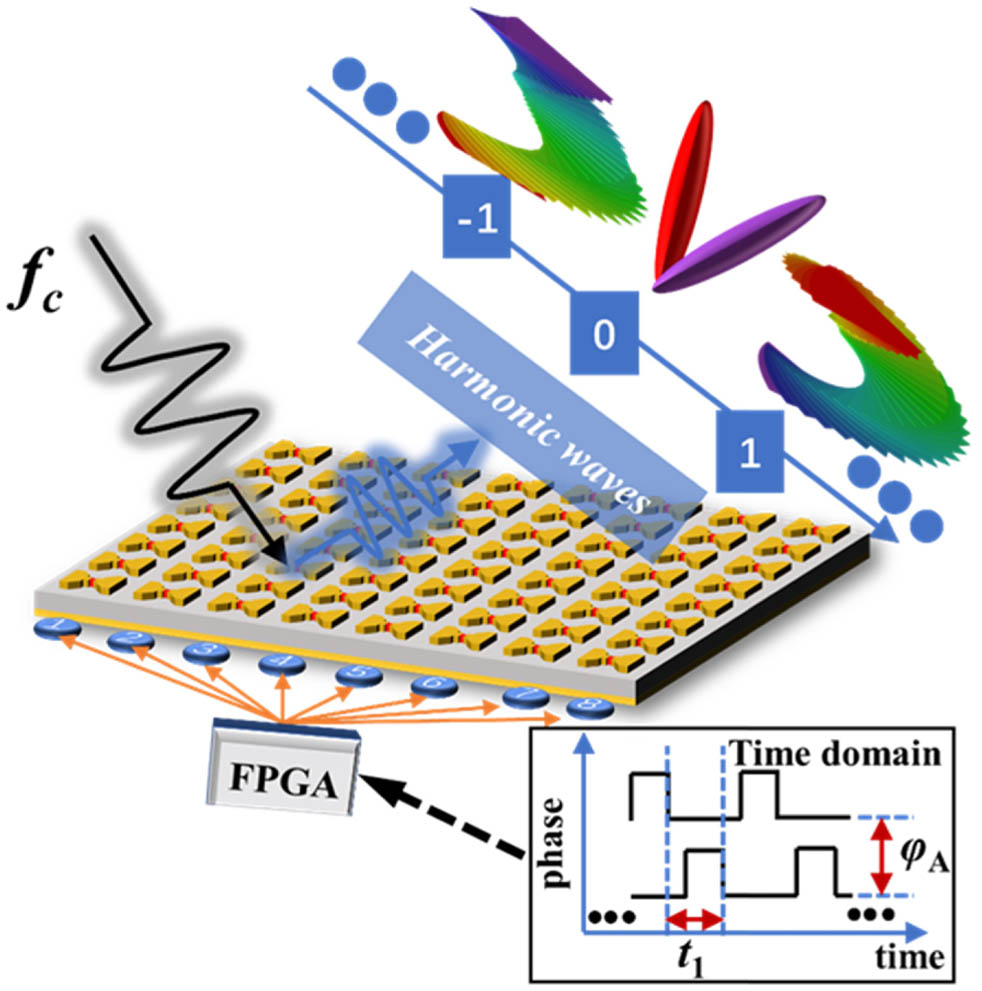
Fig. 1. Schematic of the space-time digital coding metasurface, which can independently control the wavefronts of the fundamental and high-order harmonics by adjusting the phase φ A t 1
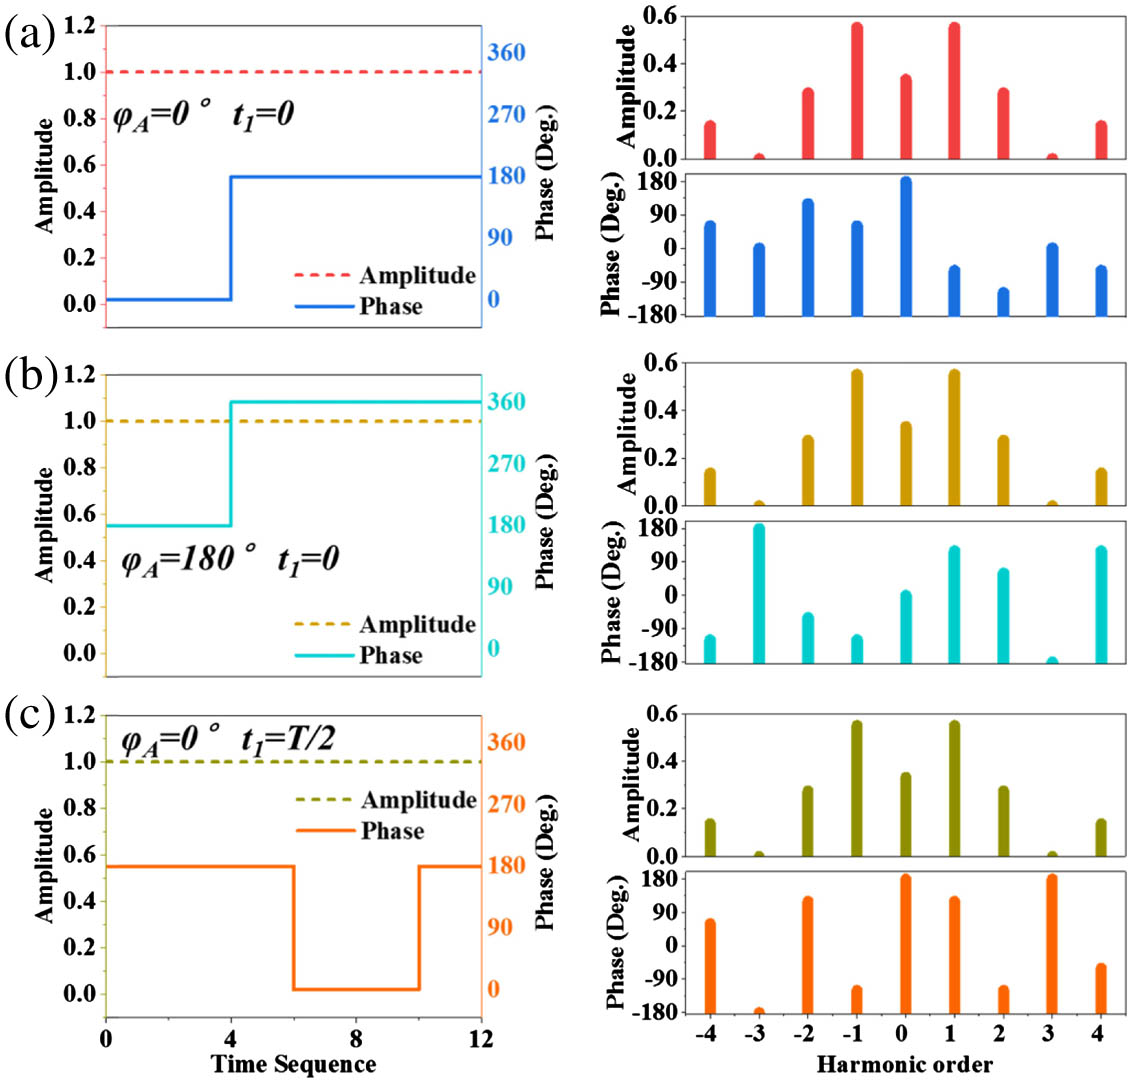
Fig. 2. Reflection amplitudes and phases of Γ p q ( t ) φ A t 1 φ A = 0 ° t 1 = 0 φ A = 180 ° t 1 = 0 φ A = 0 ° t 1 = T / 2
Fig. 3. (a) Perspective view, (b) top view, and (c) bottom view of the metaatom. (d) The simulated reflection spectra of the metaatom under the normal incidence. (e) The scattering patterns of the metaatom for the on and off states. The geometric parameters of the metaatom are p = 14 h 1 = 0.8 h 2 = 4 d 0 = 0.7 x 1 = 2 y 1 = 4 x 2 = 0.4 y 2 = 0.6 x 3 = 0.15 x 4 = 0.8 mm
Fig. 4. (a) Required phase distributions of the different harmonics. (b) The corresponding far-field scattering patterns. (c), (d) Near-field amplitude and phase distributions for the − 1
Fig. 5. (a) Front view and (b) back view of the proposed space-time digital coding metasurface. (c) Measured reflection spectra for the on and off states of the PIN diodes. (d) Measured harmonic amplitude distributions under two coding sequences 111100000000 and 000011111111, respectively.
Fig. 6. (a) Schematic of the experimental setup for measuring the harmonic near-field distributions. (b) Photograph of the nonlinear near-field experiment environment. (c) The coaxial probe for near-field detection. (d) The waveguide antenna as the excitation of the metasurface. (e), (f) Measured amplitude and phase distributions of the fundamental and ± 1
|
Table 1. Combination Values (

Set citation alerts for the article
Please enter your email address
© Copyright 2018-2021 | Chinese Laser Press. All Rights Reserved 沪ICP备15018463号-20