
Hongsheng Cui, Tao Jiang. Laser Dazzler with Automatic Focal Length Adjustment for Pedestrians[J]. Laser & Optoelectronics Progress, 2021, 58(12): 1212002
- Laser & Optoelectronics Progress
- Vol. 58, Issue 12, 1212002 (2021)
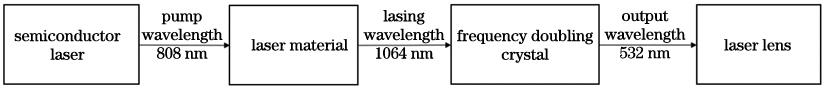
Fig. 1. Schematic of laser components
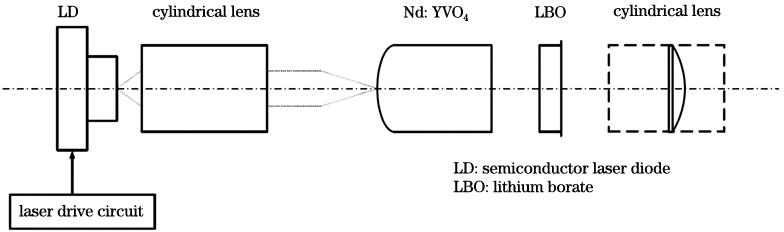
Fig. 2. Laser component structure diagram
Fig. 3. Haar features applied to pedestrian
Fig. 4. Rectangular feature
Fig. 5. Schematic of integral graph calculation
Fig. 6. Haar eigenvalue calculation diagram
Fig. 7. Training flowchart of Gentle Adaboost classifier
Fig. 8. Pedestrian detection test results
Fig. 9. Diagram of DSP pedestrian detection hardware circuit structure
Fig. 10. Diagram of STM32 circuit structure
Fig. 11. Automatic focusing control circuit board
Fig. 12. Flow of pedestrian detection program based on DSP
Fig. 13. Schematic of STM32 focusing program
Fig. 14. Test results of single person with different sizes
Fig. 15. Test results of multi persons
|
Table 1. Opencv pedestrian detection test results
|
Table 2. Comparison of detection speed before and after optimization
|
Table 3. Comparison table of target size and lens preset position

Set citation alerts for the article
Please enter your email address
© Copyright 2018-2021 | Chinese Laser Press. All Rights Reserved 沪ICP备15018463号-20