• Laser & Optoelectronics Progress
  • Vol. 56, Issue 24, 241405 (2019)
Dongshuai Liu, Yanming Lü*, Wenjun Zhou, Hua Yang, and Kang Wang
Author Affiliations
  • Jiangsu Key Laboratory of Advanced Food Manufacturing Equipment Technology, School of Mechanical Engineering, Jiangnan University, Wuxi, Jiangsu 214122, China
  • show less
    DOI: 10.3788/LOP56.241405 Cite this Article Set citation alerts
    Dongshuai Liu, Yanming Lü, Wenjun Zhou, Hua Yang, Kang Wang. Numerical Simulation of Temperature Field in TIG Arc-Additive Manufacturing Based on ANSYS[J]. Laser & Optoelectronics Progress, 2019, 56(24): 241405 Copy Citation Text show less
    Physical and point cloud data of weld bead. (a) Single-layer weld bead; (b) point cloud of weld bead
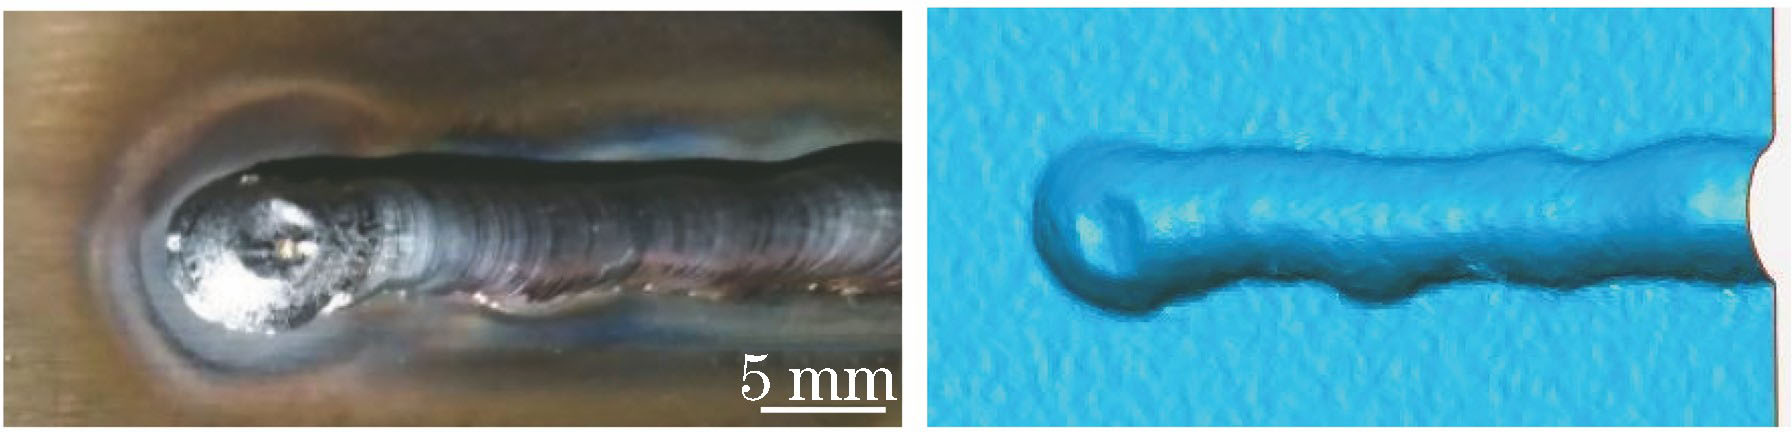
    Fig. 1. Physical and point cloud data of weld bead. (a) Single-layer weld bead; (b) point cloud of weld bead
    Simplified weld bead section model
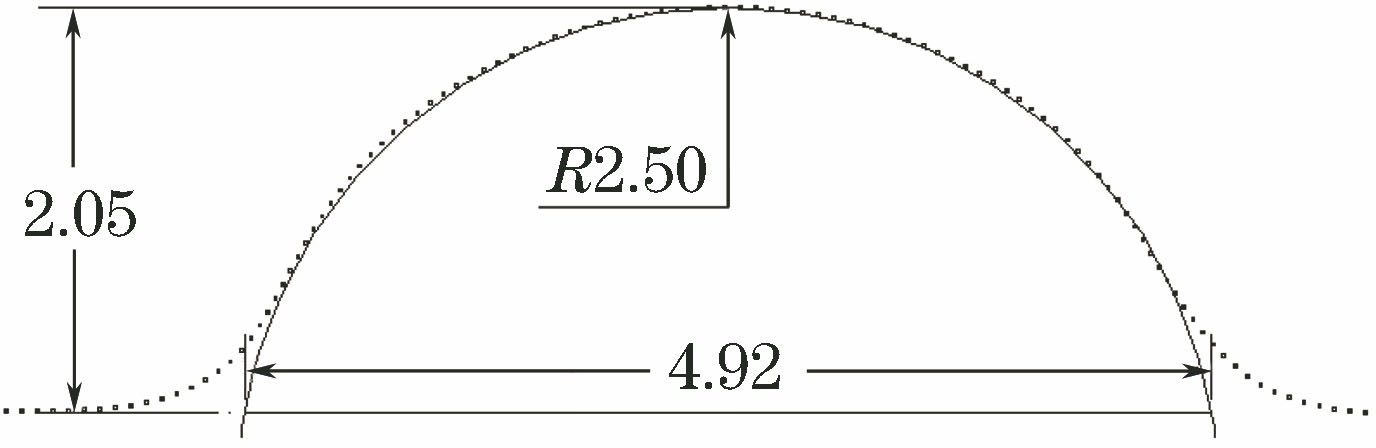
    Fig. 2. Simplified weld bead section model
    Finite element mesh model
    Fig. 3. Finite element mesh model
    Temperature distribution of plate for 70-s cooling after welding
    Fig. 4. Temperature distribution of plate for 70-s cooling after welding
    Node selection and temperature distribution at different time. (a) Node selection; (b) temperature after welding and temperature for 70-s cooling after welding
    Fig. 5. Node selection and temperature distribution at different time. (a) Node selection; (b) temperature after welding and temperature for 70-s cooling after welding
    Variation in temperature at each edge point of weld with time
    Fig. 6. Variation in temperature at each edge point of weld with time
    Comparison of simulated and actual temperatures of weld bead edge at different time. (a) After welding; (b) cooling for 70 s after welding
    Fig. 7. Comparison of simulated and actual temperatures of weld bead edge at different time. (a) After welding; (b) cooling for 70 s after welding
    Variation in temperature of welding end point with time
    Fig. 8. Variation in temperature of welding end point with time
    Variation in temperature at the midpoint of weld bead edge with time
    Fig. 9. Variation in temperature at the midpoint of weld bead edge with time
    Multi-layer welding grid model. (a) Model of weld bead; (b) grids of weld bead
    Fig. 10. Multi-layer welding grid model. (a) Model of weld bead; (b) grids of weld bead
    Variation in temperature at midpoint of intersection line of bead edge and substrate with time
    Fig. 11. Variation in temperature at midpoint of intersection line of bead edge and substrate with time
    Variation on temperature at peak of side wall center of each welding layer with time
    Fig. 12. Variation on temperature at peak of side wall center of each welding layer with time
    Temperature distribution of wave peaks in each layer
    Fig. 13. Temperature distribution of wave peaks in each layer
    IngredientMass fraction /%
    CCrMnNiSiPSCu
    Substrate0.50.250.80.250.370.0350.0350.025
    Wire0.15-1.85-1.150.0250.0350.5
    Table 1. Chemical composition of substrate and wire
    Temperature /45 steelER50-6
    Density /(g·cm-3)Specific heat /(J·g-1·℃-1)Heat conductivity /(W·m-1·℃-1)Density /(g·cm-3)Specific heat /(J·g-1·℃-1)Heat conductivity /(W·m-1·℃-1)
    257.820.4647.047.770.4827.78
    2007.760.5344.187.720.5430.66
    4007.700.6239.077.650.6330.86
    8007.610.6026.517.520.6925.45
    12007.400.6631.327.310.6730.23
    16006.880.831406.790.84140
    20006.540.831406.450.84140
    Table 2. Thermophysical coefficients of ER50-6 and 45 steel
    Dongshuai Liu, Yanming Lü, Wenjun Zhou, Hua Yang, Kang Wang. Numerical Simulation of Temperature Field in TIG Arc-Additive Manufacturing Based on ANSYS[J]. Laser & Optoelectronics Progress, 2019, 56(24): 241405
    Download Citation