Abstract
Aiming at the problem that the deformation measurement of thin-walled part is difficult and complicated, a method of deformation measurement of thin-walled part based on binocular vision is proposed. For the surface deformation of the part, a rigid metal block with reference coordinate system markers is installed on the measured part, and the designed coded targets and color circular markers are pasted on the surface of the part. The effective image region of the reference coordinate system and the coded targets are segmented by the color circular markers, which can eliminate the interferential image features. The identification and detection of coordinate system markers and coded targets are carried out, which realizes the accurate location of centers by using the designed corner structure, and then the 3D coordinates of the measurement points are calculated. The surface deformation of the part is calculated by comparing the changes of the 3D coordinates of the measurement points before and after part deformation. For the edge deformation of part, the improved Canny algorithm is used to extract the edge contour information of part, then the stereo matching and 3D reconstruction are carried out based on epipolar constraint and gray similarity. The experimental results show that the measurement method is reasonable and effective, and the measurement accuracy meets the requirements.0 Introduction
Geometric measurement of parts deformation is widely used in mechanical manufacturing, aerospace, industrial production, construction engineering, and other fields. Presently, the measurement methods of structural deformation of parts mainly include optical fiber measurement, strain gauge measurement, three-coordinate measurement, computer vision measurement, which measure the deformation of the parts by measuring displacement or strain, and the traditional deformation measurement methods are mostly contact measurement[1-2]. However, for the thin-walled parts which are easy to be deformed under the action of external force, the surface and edge deformations of the parts are irregular, and the traditional contact measurement method is difficult to achieve high measurement accuracy. In addition, the measurement process is inefficient and tedious[3-4]. Although the Coordinate Measuring Machine (CMM), total station and laser tracker have high measurement accuracy, the measurement equipment is expensive and the operation is complicated, so it is difficult to realize on-site detection in some special occasions[5]. Moreover, the contact measurement may cause additional deformation, which will result in discrepancies between the measurement results and the actual size parameters. Therefore, the contact measurement method is not suitable for this kind of deformation.
Non-contact measurement meets the requirements of modern industry and scientific research for intelligent and efficient measurement technology. At present, the non-contact measurement of parts in the industrial field is mainly optical measurement, which mainly includes laser measurement, 3D structured light measurement and passive vision measurement[6-7]. Binocular stereo vision measurement is a kind of passive vision measurement technology based on computer vision, which uses two cameras with the same parameters and a certain installation position relationship to shoot the measured object, then carries out image processing and 3D measurement by using parallax principle[8]. This measurement method has the advantages of fast measurement speed, good real-time performance, high measurement accuracy, low measurement cost, and convenient operation[9-10]. Therefore, it has become a research hotspot in the field of measurement. XIE Ze-xiao et al. realized the measurement of round hole of thin-wall parts based on binocular vision, and the accurate measurement of round hole contour is realized by edge detection and stereo matching algorithm[11]. WANG Cong-zheng et al. built a fuel assembly deformation detection system based on underwater binocular vision. By using Harris feature point and regional grayscale cross correlation method, the fast stereo matching between the binocular camera module and the radiated noise is realized, but the operation process is complex[12]. LIU Kai et al. proposed a kind of dynamic measurement technology of membrane dot matrix projection, but the measuring system is complex and expensive, and the center extraction precision of laser spot is not high[13]. SHU Xin-wei et al. put forward a method of low-frequency vibration measurement based on binocular vision, which can meet most of the requirements of vibration displacement measurement[14]. Combining binocular vision, photogrammetry and image processing algorithm, TANG Zheng-zong et al. carried out the research on deformation detection of object structure in material mechanics, which realized the measurement of the strain field with small error and dynamic observability[15]. The measurement of thin-walled parts deformation, especially for the measurement of the edge deformation, has important research significance.
Therefore, this paper proposes a method to measure the deformation of the thin-walled parts by using the coded targets and edge features. Based on the principle of binocular stereo vision, the deformation of the measured parts is measured by camera calibration, image recognition and spatial location of the reference coordinate system and coded targets. Then the surface deformation of the parts is determined by calculating the coordinate value changes of the coded targets before and after parts deformation. The methods of edge detection and stereo matching are used to calculate the deformation of parts edge, which realizes the purpose of measuring the deformation of thin-walled parts efficiently and accurately.
1 Principle of binocular stereo vision measurement and camera calibration
1.1 Mathematical measurement model
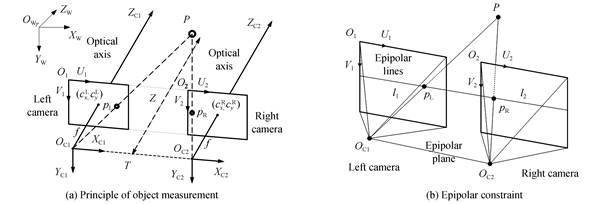
Binocular stereo vision is a kind of measurement technology which has been wildly used in computer vision measurement. According to the principle of stereo disparity and triangulation, the binocular stereo vision system can calculate the disparity and 3D coordinates of object by processing the object images captured from the left and right cameras at one time. As illustrated in Fig.1(a), in the ideal binocular vision system, the optical axes are parallel, OC1-XC1YC1ZC1 and OC2-XC2YC2ZC2 are the camera coordinate systems of the left camera and the right camera, OW-XWYWZW is the world coordinate system. The OC1 and OC2 are the optical centers of the left camera and the right camera respectively, and the distance between OC1 and OC2 is baseline denoted by T.The two cameras have the same focal length f, $ \left( {c_x^L, c_y^L} \right) $ and $ \left( {c_x^R, c_y^R} \right) $ are optical center coordinates on the image plane. P(XC, YC, ZC) is an object point in the camera coordinate system OC1-XC1YC1ZC1, and the projection points of P on the left and right image plane are pL(xL, yL) and pR(xR, yR), which are in the image coordinate systems of O1-U1V1 and O2-U2V2 respectively. In the OC1-XC1YC1ZC1, the 3D coordinates of P(XC, YC, ZC) can be calculated by Eq.(1).

Figure 1.Measurement principle of binocular stereo camera
As shown in Fig.1(b), the projection point of P on the image sensor of the left and right camera image sensors have an epipolar constraint relationship. In stereo matching, if a projection point pL is known, the corresponding projection point pR can be found by searching on the epipolar line on the right camera image. In this way, the search dimension of stereo matching can be reduced from 2D to 1D, and the running time and efficiency of the stereo matching algorithm can be improved. For the binocular vision model where the optical axes of the left and right camera are parallel, the epipolar line is a straight line parallel to the U-axis.
1.2 Camera calibration and stereo correction
For the binocular stereo vision measurement system, there are lens distortions and mechanical installation errors in cameras. Therefore the binocular camera needs to be calibrated to obtain the internal parameter matrix A, distortion parameters of the left and right cameras, the rotation matrix R and translation matrix T between the left and right camera coordinate systems. The distortions of the images can be corrected by the image processing system according to the calibration results. In this paper, the binocular stereo camera is calibrated by ZHANG Zheng-you's calibration algorithm and MATLAB toolbox[16]. Then, the distortion correction and stereo correction are carried out to make the optical axes of the two cameras parallel and satisfy epipolar constraint.
Figure 2.Calibration principle and method of binocular camera
The mathematical model of internal parameters calibration is shown as Eq.(2).
where, $ \hat P({{X}_{\rm{w}}}, {{Y}_{\rm{w}}}, {{Z}_{\rm{w}}}) $ is an object point in the world coordinate system OW-XWYWZW, $ \hat p(x, y) $ is the projection point of $ {\hat P} $ in image coordinate system O-UV, fx=f/dx and fy=f/dy are scale factors, dx and dy are pixel size, (cx, cy) is optical center coordinate, A is the internal parameter matrix of camera. RD and TD are the rotation matrix and translation matrix between camera coordinate system OC-XCYCZC and world coordinate system OW-XWYWZW respectively, oT=(0, 0, 0), M is the external parameter matrix of camera.
The mathematical model of distortion correction is shown as Eq.(3)
where, (xd, yd) is the distorted image coordinate in image coordinate system O-UV, $ \left( {{{\hat x}_d}, {{{\rm{\hat y}}}_d}} \right) $ is the undistorted image coordinate in image coordinate system O-UV, r2=(xd-cx)2+(xd-cy)2, k1 is the two-degree radial distortion coefficient, k2 is the four-degree radial distortion coefficient, k3 is the six-degree radial distortion coefficient, p1 and p2 are the one-degree and two-degree tangential distortion coefficient. The change of 3D points in the process of removing distortion can be calculated by Eq.(1) to Eq.(3). The main calibration principle and method of the binocular camera is shown in Fig.2.
2 Visual measurement method of thin-walled parts deformation
As shown in Fig.3(a), irregular plastic deformation occurs on the surface and edge of the thin-walled part when it is subjected to large external forces. Traditional contact measurement methods are not suitable for measuring this deformation. In this paper, the binocular stereo vision measurement method is used to realize the efficient, convenient and accurate measurement of this complex deformation.
Figure 3.Visual measurement method of thin-walled parts deformation
Binocular vision measurement requires a world coordinate system as the reference. The world coordinate system is established on a rigid metal block. As shown in Fig.3(b), the surface of the metal block is affixed with four blue circular markers for location and three black and white markers for determining the origin and orientation of the coordinate system. The metal block is fixed to the measured part, and no deformation occurs before and after the part is stressed. In order to facilitate the measurement of surface deformation, four green circular markers and 96 coded targets are pasted on the surface of the thin-walled part, where the spatial distribution of the coded points is grid-like, as shown in Fig.3(b).
The algorithm flow for deformation measurement of thin-walled parts in this paper is shown as Fig. 3(c).
1) Firstly, the images before and after the deformation of parts are captured, and then the distortion correction and stereo correction of the images are carried out.
2) Secondly, the images are segmented by using the blue and green circular markers to obtain the effective image regions of the reference world coordinate system and coded targets. By detecting and identifying the black and white markers, the origin and orientation of the reference world coordinate system are extracted.
3) Then, the 3D coordinates of the coded targets in the reference coordinate system can be obtained by identifying, decoding, sorting the coded targets on the surface of the part. Next, the surface deformation of the part is calculated according to the coordinate change of the coded targets before and after part deformation.
4) Finally, the image edge detection algorithm is used to extract the edge contour information of the part. The deformation of the edge of the part is calculated by stereo matching and 3D reconstruction.
2.1 Image recognition and spatial location of reference world coordinate system
In order to identify and locate the rigid metal block conveniently, four blue circular markers which have obvious color image feature are pasted on its surface. The blue circular markers are identified by image segmentation based on HSV color space[17], and the center coordinates of them are calculated by gravity method. Then the ROI (Region Of Interest) of the reference world coordinate system is determined by these four center coordinates, which can eliminate the interference of other invalid image features, simplify the image processing algorithm and improve the operation efficiency. The image processing result is shown in Fig.4(b).
Figure 4.Image recognition of world coordinate system
The center coordinates of the three black and white markers are calculated by Harris corner detection algorithm, and the three coordinate points are sorted by position relation, where point 1 represents the origin of coordinate system, the vector composed of points 1 and 3 represents the X-axis, and the vector composed of points 1 and 2 represents the Y-axis, as shown in Fig.4(c). In the following image processing, all measured points are based on this coordinate system, so that it is convenient to compare and calculate the part deformation.
2.2 Visual location of coded targets on the surface of thin-walled part
A kind of coded target is designed, which consists of a circular marker and coded ring. As shown in Fig.5(a), the inside of the circular marker is the corner structure which used to extract the center of the circle, and the coded ring is a segmented ring region concentric with the circular marker. Compared with the traditional Schneider target[18], the coded target designed in this paper is convenient for image processing, and the location accuracy of the center is higher. The coded principle is shown in Fig.5(b), and the coded ring is divided into 8 parts on average. Except that the starting identification part is red, each part is black or white, representing binary "0" and "1" respectively. In Fig.5(b), the ID of coded target is decimal "10". In this way, each coded target has an independent ID, which is convenient for stereo matching in binocular vision measurement.
Figure 5.Visual detection and location of coded targets
The image of the measured part collected by the camera is shown in Fig.5(c). Due to the shooting angle and part deformation, the outer contours of the circular marker images are irregular circles, and most of them are approximate ellipses. The algorithm flow of automatic recognition and location of the coded target is shown in Fig.5(d).
1)aROI segmentation and image edge detection
According to the recognition and location algorithm of color markers in section 2.2, the center coordinates of four green markers in the image are extracted, and the ROI of the coded targets is determined, as shown in Fig. 6(a). Then the 33 Gaussian kernel is used for Gaussian filtering, and the image is binarized. Finally, canny edge detection algorithm[19] is used to extract the contour information in the image, the result of edge detection is shown in Fig.6(b).
Figure 6.Detection and location of circular markers
2)aDetection and location of circular markers
The results of edge detection both include the contour information of circular markers and coded rings. Firstly, the identification of elliptical contours for circular markers is carried out. A roundness parameter k is defined, which is shown as Eq.(4)
where, A is the area surrounded by the contour, L is the perimeter of the contour. The roundness value of the standard circle is k=1, and for the ellipse is $ {\rm{q}} \le k < 1 $, where the threshold value q is set according to the specific situation of the image. In this paper, the default value of q is 0.8. The ellipse contours can be preliminarily filtered by using the roundness parameter k. In order to further accurately detect ellipses and determine the parametric equation of ellipses, the least square method is used to carry out ellipse fitting. For the ellipse in any position, its equation can be represented as Eq.(5)
The least square fitting is performed for N points on the ellipse contour to minimize the objective function as shown in Eq.(6)
where, i is the serial number of points on the ellipse contour from 0 to N. According to the extreme principle, another kind of ellipse equation can be represented as Eq.(7), parameters A~E can be solved by Eq.(7) and Eq.(8)
where, (x, y) is the coordinate of the ellipse in image coordinate system O-UV, (x0, y0) is the coordinate of the ellipse center in image coordinate system O-UV, a and b are semi-major axis and semi-minor axis respectively, Lj is the angle between the semi-major axis and V-axis, as shown in Fig.7(a).
The result of the ellipse detection is shown in Fig. 6(c). Although the ellipse fitting method can detect ellipse and calculate ellipse equation quickly and efficiently, the center obtained by ellipse equation is not the true center of circular marker due to the target deformation, and the maximum error can be up to 5 pixels. Therefore, in this paper, a corner structure in the circular marker is designed. The coordinates of the corner points are calculated by Harris corner detection algorithm[20-21], and the accuracy of the corner extraction can reach 0.2 pixels. The centers of circular markers are shown in Fig.6(d).
Figure 7.Geometric parameters of the ellipse in image coordinate
3)aDecoding of coded ring
Firstly, the quadrilateral effective image region of the coded target is extracted according to the center coordinates of the circular marker itself and its adjacent markers, and the side length of the quadrilateral is half of the central line of adjacent markers, as shown in Fig.8(a). In order to standardize the projection shape of the coded targets, the parameters obtained by ellipse fitting are used to perform an affine transformation on the image. The coordinate transformation relationship is shown as Eq.(9)
where, $ \left( {{\hat x},{\hat y}} \right) $ is the image coordinate of the neighborhood of ellipse center in the original image, $ \left( {{\hat x},{\hat y}} \right) $ is the normalized image, $ \left( {{\hat x},{\hat y}} \right) $ and $ \left( {{\hat x},{\hat y}} \right) $ are in the image coordinate system O-UV, (x0, y0), a, b and Lj are ellipse parameters calculated by ellipse fitting in coordinate system O-UV, r is the radius of the circular marker in image after affine transformation and r=a, as shown in Fig.8(b).
Figure 8.Decoding of coded ring
The centroid method is used to calculate the centroid of each ring segment in the coded ring, and the average distance R between each centroid and the circular marker center. Then, the centroid of the red starting area is taken as the scanning starting point, and the image region with a width of 3 pixels is scanned at 45£ intervals around the circular marker center with scanning radius R. The value of the coded ring is finally determined based on the scan results. The image processing process is shown in Fig.8(c).
4)aStereo matching and 3D coordinate calculation
According to the ID of the coded targets and binocular camera measurement formula, stereo matching is carried out for the coded targets in the left and right images, and the 3D coordinates of the location points are calculated for the matched point pairs.
2.3 Stereo matching and measurement of edge deformation for thin-walled part
Although the edge of the part is relatively thin, there are two close contours in the edge detection results of the part when the resolution of the binocular camera is high and the shooting distance is relatively short, as shown in Fig.9(a), which will affect the stereo matching and produce more mismatches. In this paper, the traditional Canny edge detection algorithm is improved. For the two edges with close distance, the following processing method is used to remove the interfered contour information.
Figure 9.Calculation of effective edge contour
Firstly, the intersection points between the edge contour and the horizontal scan line Hi are calculated from the first row to the last row in image, and a parameter n is set according to the actual situation. Then the distances between each point pair on the line Hi are calculated, and the two points whose distance is less than n are taken as the candidate points $ P_1^i $ and $ P_2^i $. Next, the point $ P_3^i $ with the largest average distance from $ P_1^i $ and $ P_2^i $ is found and the distances are $ D_1^i $ and $ D_2^i $ respectively. If $ D_1^i $, point $ D_2^i $ is reserved, otherwise point $ P_1^i $ is reserved, as shown in Fig. 9(b). The effective edges along the vertical scan line are determined in the same way, as shown in Fig.9(c).
The algorithm flow of stereo matching of part edge contour is as follows.
1) Firstly, the contours of the coded targets are filtered out by the coordinates of the four green circular markers which are pasted on the part, and the contours of the metal block and blue markers are filtered out by the coordinates of the four blue circular markers which are pasted on the rigid metal block.
2) Then, improved canny algorithm and polygon approximation method[22] are used to extract the feature points of part edge contour, as shown in Fig.10(a).
3) Finally, the stereo matching and 3D reconstruction of feature points on the contour are carried out.
By using the epipolar geometry constraint in binocular vision, a search is performed on the epipolar line along the positive direction of the image x-axis, and the candidate feature point pairs on the epipolar line in the left and right images are extracted. In order to achieve the accurate matching of feature points, a rectangular window with the size of (2n+1, 2n+1) is established which uses each feature point as the center. Then the gray value of the elements in the rectangular window is calculated, and the gray similarity is used as an evaluation index to match the feature points, as shown in Fig.10(b).
Figure 10.Extract and stereo matching of feature points
Along the positive direction of the y-axis, the matched feature point pairs on each epipolar line are searched in turn. Then the coordinate points are calculated and converted to the reference world coordinate system. In this way, the 3D information of the part edge and deformation can be obtained.
3 Experiments
The binocular stereo vision measurement system built in this paper is shown in Fig.11. which mainly included two industrial cameras with 6 mm fixed focus lens, binocular camera fixed platform, tripod, high-precision chessboard calibration board, measured part, high-precision target, computer and upper computer software. The performance parameters of the two industrial cameras are the same, and the resolution is 2 592 pixel1 944 pixel.
Figure 11.Binocular stereo vision measurement system
3.1 Camera calibration
The binocular camera was calibrated by using the checkerboard calibration board with 129 square lattices. The calibration results are shown in Table 1, and then the distortion correction and stereo correction of binocular vision system were carried out by using these results.
| Parameter name | Left camera | Right camera |
| Focal length | | |
| Principal point | | |
| Distortion | | |
| Rotation matrix | |
| Translation matrix | |
Table 1. Calibration results of binocular camera
3.2 Deformation measurement experiment
In order to verify the effectiveness of the measurement method in this paper, the deformation measurement experiment of thin-walled plate was carried out. The 3D size of plate is 160 mm100 mm0.3 mm and rigid metal block will not cause additional deformation. As the deformation is complicated and difficult to achieve contact measurement, it is difficult to obtain real data for comparing the accuracy of visual measurement. In order to verify the measurement accuracy of the deformation, a high-precision target as shown in Fig.12 was placed next to the measured plate, which had four coded targets and the curves used to verify the accuracy of edge measurement.
Figure 12.Deformation measurement and 3D reconstruction results
Firstly, the images before and after the deformation of the thin-walled plate were photographed with binocular camera respectively, as shown in Fig.12(a). Through the algorithm in this paper, the deformation measurement of the thin-walled plate surface and 3D reconstruction were carried out. Then, the edge deformation of thin-walled plate was measured by using the algorithm flow of stereo matching in section 2.3, and the feature point matching results is shown in Fig.12(b). The 3D reconstruction result of thin-walled plate deformation is shown in Fig.12(c), which both includes the surface and edge deformation of part.
The measurement results and error of the distance between the four location points on the high-precision target are shown in Table 2. The results show that the relative error of measurement is less than 0.27% and the measurement error of curves on the target is less than 0.83%.
| Measured object | True value/mm | Measured value/mm | Error/% |
| 16 | 16.043 | 0.268 8 |
| 16 | 16.037 | 0.231 2 |
| 22.627 | 16.054 | 0.238 7 |
| Circle edge feature | í | í | 0.542 6 |
| Rectangle edge feature | í | í | 0.771 3 |
| Cross edge feature | í | í | 0.827 9 |
Table 2. Measurement results of high-precision target
The implementation of the algorithm in this paper is based on OpenCV 2.4.9, Microsoft Visual Studio 2010 and MATLAB 2016b. The processor of computer is i5 (main frequency 1.8 GHz) and the memory is 8G. In this experiment, the total execution time of the algorithm is 5.68 s, excluding the time of experimental preparation and software operation. The effective time of entire measurement process is 5 to 6 min.
In order to verify the effectiveness of the algorithm in this paper, the Schneider targets and cross marker point were pasted on the same thin-walled part to measure the surface deformation. As shown in Fig.13(a), the center points of the cross markers can be calculated by Harris corner detection algorithm. When the deformation amount of part is small, these center points can be automatically sorted according to the image coordinate size. However, when the deformation amount of parts is large, as shown in Fig.13(b), the automatic sorting cannot be realized, and only the manual identification can be performed.
Figure 13.Comparison experiment of deformation detection algorithm
As shown in Fig.13(c), the deformation of thin-walled part will lead to the deformation of the circular marker, and the detection result of its location point has a large deviation from the theoretical position. The coded target in this paper has corner structure and coded ring, which can realize the accurate extraction of the location point and the automatic sorting of the coded target. Moreover, the world coordinate system is convenient for data processing and deformation calculation of coordinate points.
For the thin-walled part with relatively thick thickness, the detection results of the traditional Canny algorithm and the improved algorithm in this paper are shown in Fig.13(d), From the results of image processing, we can see that the edge of the part obtained by the traditional Canny algorithm has a double-layer structure, which will lead to the mismatch in stereo matching. The algorithm in this paper can avoid the interference of part thickness in the edge stereo matching. The running time of improved Canny algorithm is about 2.1 to 2.3 times that of traditional Canny algorithm.
The experimental results show that the deformation measurement method proposed in this paper can realize the rapid and effective measurement of the surface and edge deformation of thin-walled plate, and meet the measurement accuracy requirements of thin-walled parts.
4 Conclusion
In this paper, aiming at the difficulty of measuring the deformation of thin-walled parts, a geometric measurement method based on binocular vision was proposed. A kind of coded target with high positioning accuracy and easy recognition was designed, and the identification and location methods of coded target were studied. In order to facilitate the measurement of deformation, coded targets and color markers were pasted on the surface of part, and the reference coordinate system was also set. Through the detection and recognition of the designed coded targets, the stereo matching and 3D coordinate calculation of location points were carried out. Then the surface deformation of part was determined by comparing the coordinate transformation of the coded targets before and after the part deformation. The edge deformation of part was measured by stereo matching and 3D reconstruction based on improved Canny edge detection algorithm, epipolar constraint and gray similarity matching method. Finally, the measurement experiment was carried out, and the experimental results show that the measurement accuracy of the method proposed in this paper is high and meets the measurement requirements, which realizes the purpose of measuring the deformation of the thin-walled part efficiently and accurately.
References
[1] Yan-ming QUAN, Shu-mei LI, Qing-qun MAI. On-machine 3D measurementof workpiece dimensions based on binocular vision. Optics and Precision Engingering, 21, 1054-1061(2013).
[2] Peng LI, Yang-yang ZHANG. Stereo vision localization for mobile robot based on auxiliary target. Infrared and Laser Engineering, 48, S117006(2019).
[3] Qi-yang XIAO, Jian LI, Si-jin WU. Measurement of objects surface deformation using EWT kernel probability density. Acta Photonica Sinica, 47, 0312001(2018).
[4] Chao FENG, Jin LIANG, Wen-yan PAI. Measurement on 3D full-field deformation of cylindrical workpieces welding. Journal of Central South University(Science and Technology), 48, 2606-2613(2017).
[5] C ZUO, Q CHEN, G GU. High-speed three-dimensional profilometry for multiple objects with complex shapes. Optics Express, 20, 19493-19510(2012).
[6] K OLEJNIK, P PELCZYNSKI, A GLOWACKA. Optical measurement of the hydrophobic properties of paper products. Measurement, 115, 52-63(2018).
[7] K RODACKI, M TEKIELI, K FURTAK. Contactless optical measurement methods for glass beams and composite timber-glass I-beams. Measurement, 134, 662-672(2019).
[8] Zhi-qiang ZHAI, Zhong-xiang ZHU, Yue-feng DU. Multi-crop-row detection algorithm based on binocular vision. Biosystems Engineering, 150, 89-103(2016).
[9] S NEFTI-MEZIANI, U MANZOOR, S DAVIS. 3D perception from binocular vision for a low cost humanoid robot NAO. Robotics and Autonomous Systems, 68, 129-139(2015).
[10] Wen-ming ZHANG, Xi-xue DENG, Qiang ZHANG. Non-parallel system underwater image transformation model. Acta Photonica Sinica, 44, 0211002(2015).
[11] Ze-xiao XIE, Xiao-dong WANG, Han-lei GONG. Round-hole profile measurement of thin-walled parts based on binocular vision. Chinese Journal of Lasers, 46, 1204004(2019).
[12] Cong-zheng WANG, Song HU, Chang FENG. Deformation detection system of fuel assembly based on underwater binocular vision. Journal of Applied Optics, 40, 246-252(2019).
[13] Kai LIU, Hang SHI, Cheng-li SU. Membrane structure dot-matrix-projected 3D dynamic deformation measurement technology. Journal of Liaoning Shihua University, 38, 86-92(2018).
[14] Xin-wei SHU, Bo YANG. The measurement of low frequency vibration based on stereo vision. Optical Instruments, 38, 95-99(2016).
[15] Zheng-zong TANG, Jin LIANG, Zhen-zhong XIAO. Digital image correlation system for three-dimensional deformation measurement. Optics and Precision Engingering, 18, 2244-2253(2010).
[16] Ze-xiao XIE, Jiang-shu YU, Shu-kai CHI. Underwater calibration and measurement based on non-parallel stereovision. Acta Optica Sinica, 39, 0912004(2019).
[17] M HAINDL, S MIKES. A competition in unsupervised color image segmentation. Pattern Recognition, 57, 136-151(2016).
[18] Xie-liu YANG, Su-ping FANG, Bing KONG. Design of a color coded target for vision measurements. Optik, 125, 3727-3732(2014).
[19] M A INGLE, G R TALMALE. Respiratory mask selection and leakage detection system based on Canny edge detection operator. Procedia Computer Science, 78, 323-329(2016).
[20] Yong ZHAO, Li ZHANG, Li-hong SONG. Fast recognition and parameters acquisition of ellipse target in visual assembly. Computer Engineering, 37, 192-194(2011).
[21] SHTIS M R, SEAGER J W, ROBSON S, et al. Automatic recognition of coded targets based on a Hough transfm segment matching[C]. Proceedings of the International Society f Optics Photonics on Electronic Imaging, 2003, 5013: 202208.
[22] Yan-qiang HU, Yue MA, Min XU. Study of on-line measurement method for 3D coordinates of body-in-white hole slot features. Computer Engineering, 43, 186-191(2017).