
Ying-Yu Cao, Jian-You Guo. Study of nuclear charge radius [J]. Acta Physica Sinica, 2020, 69(16): 162101-1
- Acta Physica Sinica
- Vol. 69, Issue 16, 162101-1 (2020)
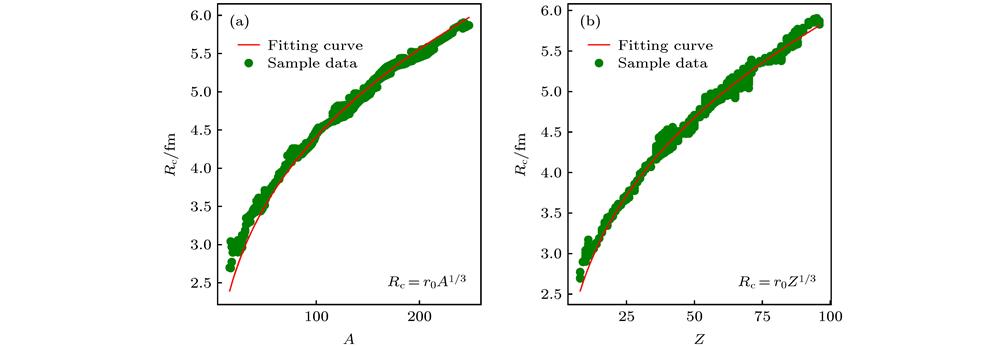
Fig. 1. The fitting curve of the Eqs. (2 ) and (4 ).(The left picture is the fitting curve of the Eq. (2 ) and the right picture is the fitting curve of the Eq. (4 ))
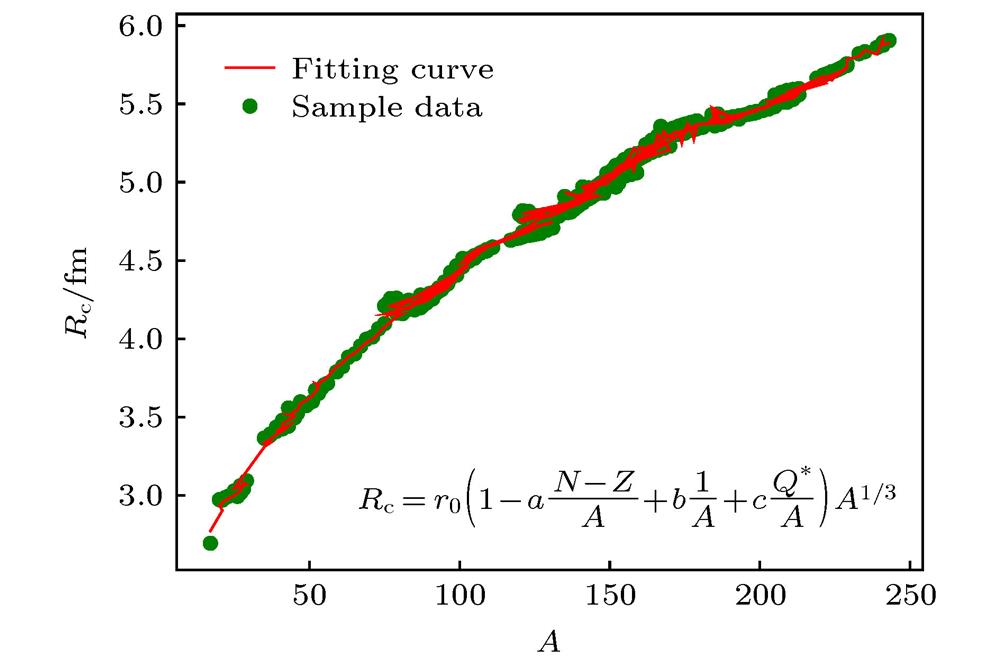
Fig. 2. The fitting curve of the Eq. (13 ).
Fig. 3. The fitting curve of the Eq. (14 ).
Fig. 4. The fitting curve of the Eq. (15 ).
Fig. 5. The experimental values of the nuclear charge radii of Ba and Fr, Ho and Lu isotopic chains are compared with the theoretical values calculated by Eqs. (13 )–(15 ).
Fig. 6. The difference between the experimental value of 368 nuclear charge radii and the theoretical value calculated by Eqs. (13 )–(15 ) , respectively.
|
Table 1. The mentioned equations for nuclear charge radius
 .
.
. 
Set citation alerts for the article
Please enter your email address
© Copyright 2018-2021 | Chinese Laser Press. All Rights Reserved 沪ICP备15018463号-20