
Ke Wang, Huiqin Wang, Yanqun Long, Weichao Wang, Lijuan Zhao, Lei Yang. Spectral Reflectance Reconstruction Based on Dimension Reduction Regularization Polynomials[J]. Laser & Optoelectronics Progress, 2018, 55(5): 053004
- Laser & Optoelectronics Progress
- Vol. 55, Issue 5, 053004 (2018)
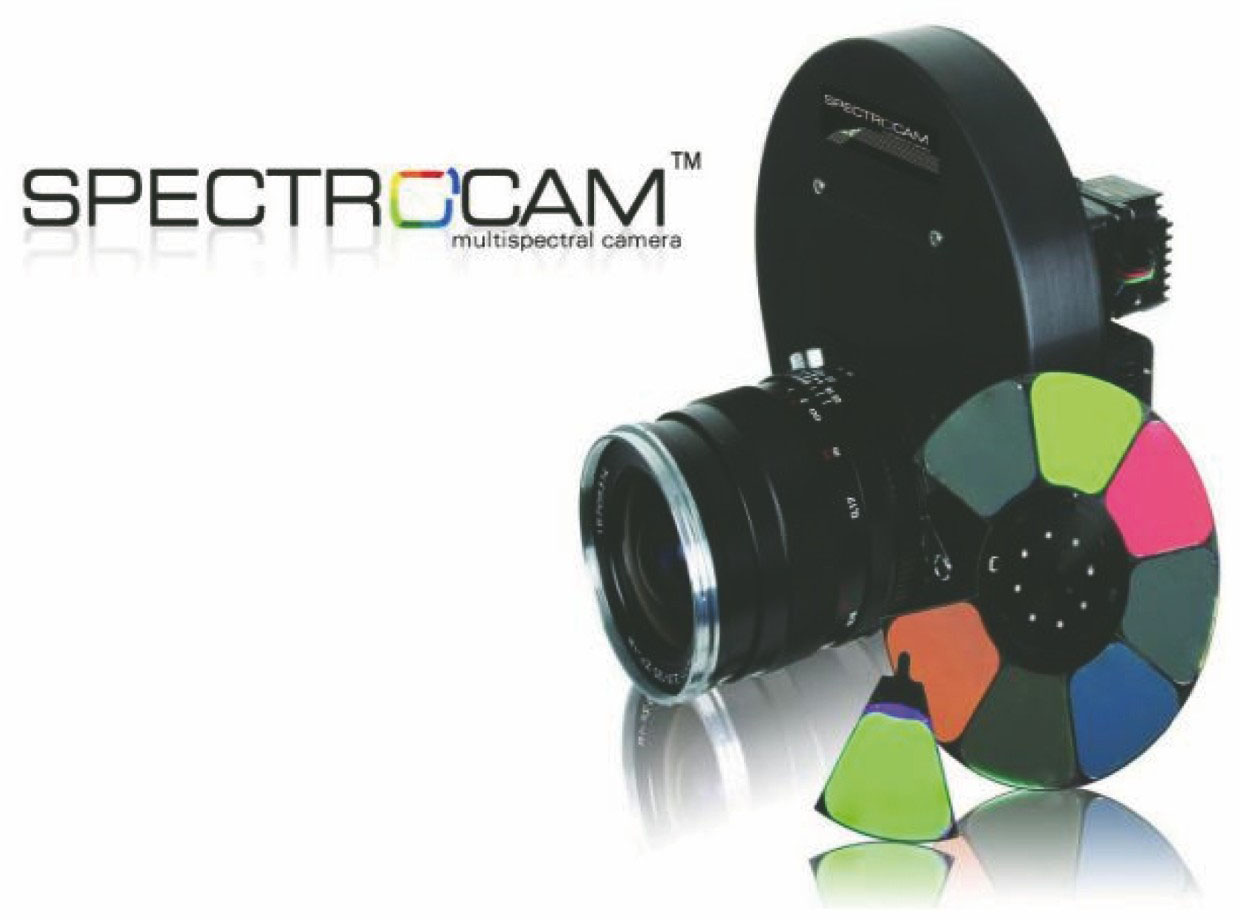
Fig. 1. Multispectral camera
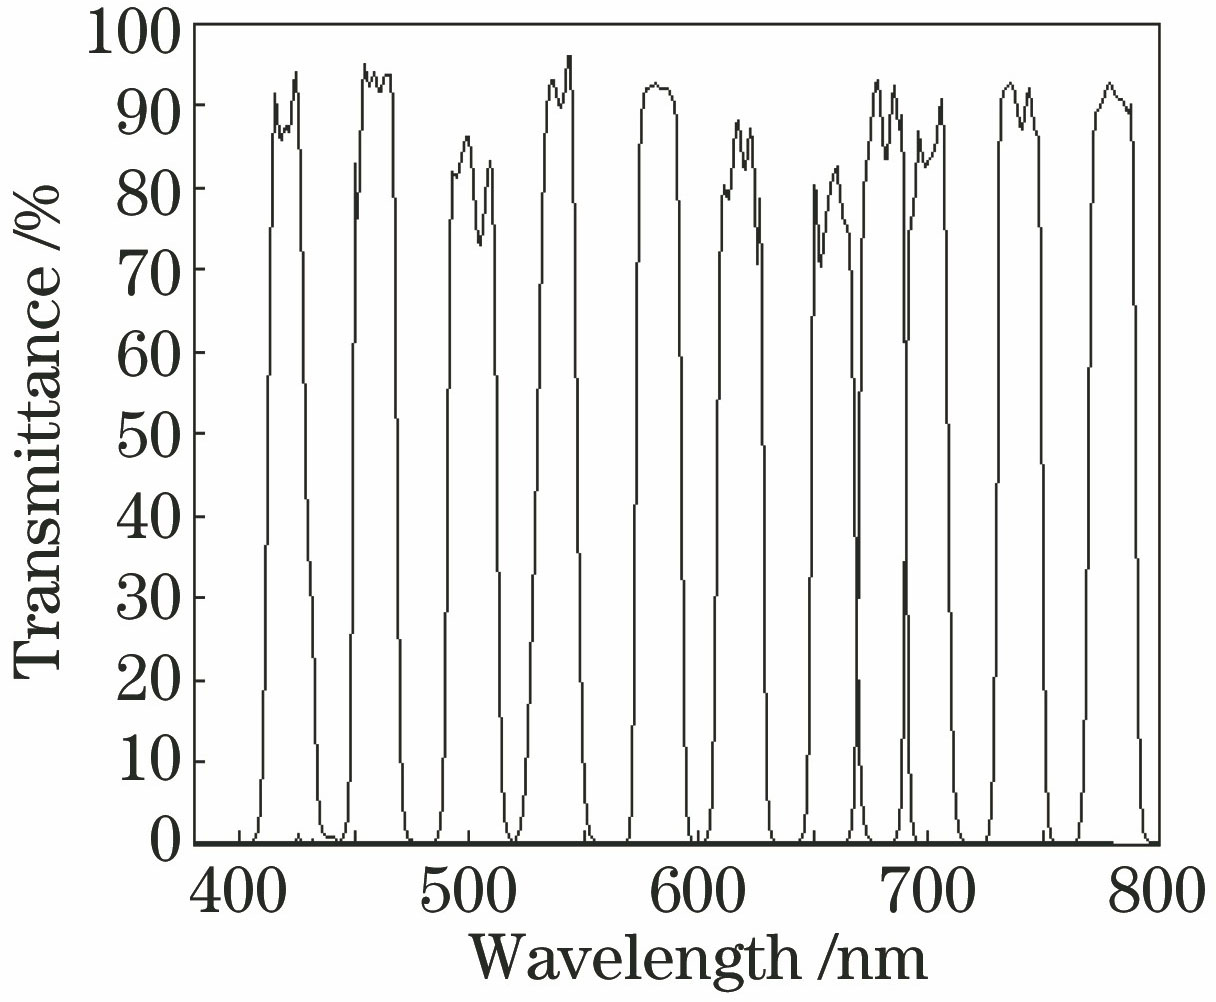
Fig. 2. Transmissivity curve of filter
Fig. 3. Relationship between training sample number and mean RMSE of reconstructed spectral reflectance
Fig. 4. Regularization parameters obtained by L-curve method. (a) Training result 1; (b) training result 2
Fig. 5. RMSE of 20 testing samples with three reconstruction methods
Fig. 6. Spectral reflectance curves with three reconstruction methods. (a) xISSD=0.022; (b) xISSD=0.121; (c) xISSD=0.351
Fig. 7. Mural referential color patches and multispectral images. (a) Markings of mural referential color patches; (b) multispectral images with 11 channels
Fig. 8. CIELAB chromaticity distribution space of mural referential color patches obtained by different reconstruction methods
Fig. 9. Reconstructed and measured spectral reflectance curves of six referential color patches of mural. (a) Color patch 1; (b) color patch 2; (c) color patch 3; (d) color patch 4; (e) color patch 5; (f) color patch 6
|
Table 1. CVC, color difference, and RMSE with different principal component numbers
|
Table 2. Color difference and RMSE with different polynomial term numbers
| ||||||||||||||||||||||||||||||||||||||||||||||||||||||||||||||||
Table 3. Spectral reflectance reconstruction accuracies of PCA, PRE and DRRP methods
| |||||||||||||||||||||||||||||||||||||||||||||||||||||||||||||||||||||||||||||||||||||||||
Table 4. Spectral reflectance reconstruction accuracies of six referential color patches of mural

Set citation alerts for the article
Please enter your email address
© Copyright 2018-2021 | Chinese Laser Press. All Rights Reserved 沪ICP备15018463号-20