• Spectroscopy and Spectral Analysis
  • Vol. 41, Issue 9, 2657 (2021)
Experimental area and experimental design
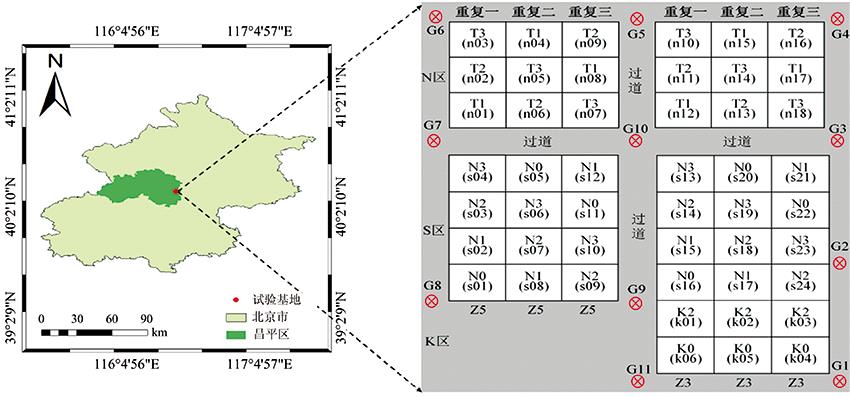
Fig. 1. Experimental area and experimental design
Spectral reflectance curves treated with SNV during potato tubergrow period
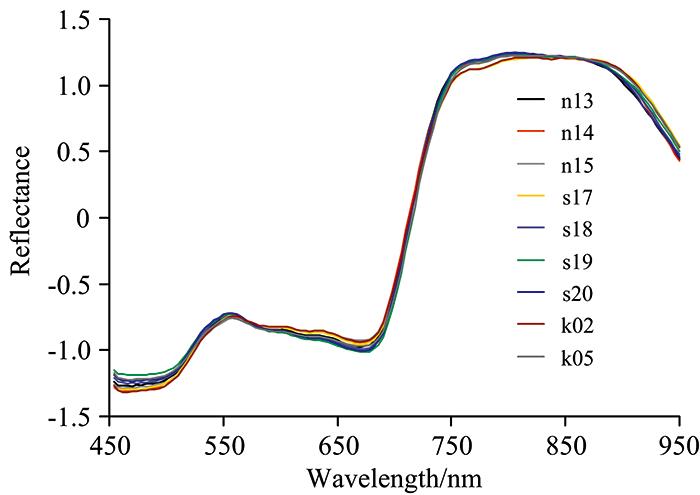
Fig. 2. Spectral reflectance curves treated with SNV during potato tubergrow period
Correlation coefficient diagrams of COS and FDS with AGB during each growth period of potato
Fig. 3. Correlation coefficient diagrams of COS and FDS with AGB during each growth period of potato
Variable selection probabilities of COS and FDS during each growth period of potato
Fig. 4. Variable selection probabilities of COS and FDS during each growth period of potato
Cross validation maps of using COS (upper) and FDS (lower) during each growth period of potato
Fig. 5. Cross validation maps of using COS (upper) and FDS (lower) during each growth period of potato
生育期COS/nmFDS/nm
块茎形成期458~514, 586~634502, 506, 530~538, 542~554, 714~722
块茎增长期458~518, 578~638494~498, 506~518, 526~550, 718~730
淀粉积累期458~518, 590~626, 790~802494~506, 530~566, 594~598, 638, 718~730
Table 1. The sensitive wavelengths selected by CAM based on FDS and COS during each growth period
生育期COS/nmFDS/nm
块茎形成期462, 502, 510, 526, 558, 562, 578, 582, 634, 806, 818, 822482~486, 506, 514, 522, 530, 542, 578, 590, 598, 630, 638, 646~650, 678, 698, 702~706, 714~718, 798, 826, 926
块茎增长期486, 498, 514, 610~614, 648, 646, 654486, 502, 518, 598, 610~618, 630~634, 642, 658, 666, 710, 722, 742~746, 758~762, 774, 810~814, 842~846, 882~890, 942~946
淀粉积累期466, 478, 526~530, 542, 606~614, 630~634, 642~646, 654, 762, 822470, 510, 518, 522~526, 558~562, 574~578, 586~590, 606~610, 618~622, 638, 646, 710, 718~722, 738, 758, 766~770, 814, 826~830, 846, 866~870, 906, 910, 922
Table 2. The sensitive wavelengths were selected by RFM based on FDS and COS during each growth period
生育期COS/nmFDS/nm
块茎形成期626, 642, 778,
822, 846, 938
482, 494, 526, 530, 534, 586, 602, 686, 702, 914
块茎增长期598, 710658, 666, 774, 782
淀粉积累期582, 798, 822550, 722, 726, 734, 866
Table 3. The sensitive wavelengths were selected by GPR-BAT based on FDS and COS during each growth period
生育期模型变量PLSRGPR
建模验证建模验证
R2RMSE/
(kg·hm-2)
NRMSE/
%
R2RMSE/
(kg·hm-2)
NRMSE/
%
R2RMSE/
(kg·hm-2)
NRMSE/
%
R2RMSE/
(kg·hm-2)
NRMSE/
%
CAM0.61240.6819.710.64191.4918.810.58259.2421.230.59209.6220.59
块茎形成期RFM0.63223.2218.280.65179.8917.670.60247.2720.250.61202.3919.88
GPR-BAT0.64215.1617.620.67172.4616.940.62237.8719.480.64190.9818.76
CAM0.65236.1618.320.66165.1718.190.62253.4419.660.63172.9819.05
块茎增长期RFM0.68221.2117.160.70152.8216.830.64239.3818.570.66161.2717.76
GPR-BAT0.71211.0316.370.72144.4715.910.67228.3017.710.68150.6516.59
CAM0.58338.8023.350.60195.1422.620.55348.9624.050.57203.6823.61
淀粉积累期RFM0.61319.6522.030.63187.5521.740.59338.2223.310.60194.1922.51
GPR-BAT0.62307.3121.180.64176.5120.460.61321.8222.180.62182.5521.16
Table 4. Modeling and verification accuracies of estimating AGB based on COS by PLSR and GPR
生育期模型变量PLSRGPR
建模验证建模验证
R2RMSE/
(kg·hm-2)
NRMSE/
%
R2RMSE/
(kg·hm-2)
NRMSE/
%
R2RMSE/
(kg·hm-2)
NRMSE/
%
R2RMSE/
(kg·hm-2)
NRMSE/
%
CAM0.64233.1119.090.66182.0317.880.60250.5720.520.62200.9619.74
块茎形成期RFM0.65214.4217.560.68177.4417.430.63235.4319.280.64189.2518.59
GPR-BAT0.67203.0716.630.70161.0515.820.65231.8918.990.68179.9917.68
CAM0.69232.1718.010.71162.1817.860.65250.4719.430.67167.9018.49
块茎增长期RFM0.71214.8916.670.72140.4715.470.68235.2618.250.69159.1817.53
GPR-BAT0.73204.1915.840.75134.6614.830.69216.9516.830.72153.5516.91
CAM0.61331.5522.850.63185.7421.530.57342.1423.580.59196.5222.78
淀粉积累期RFM0.64305.7221.070.66180.4820.920.61329.6622.720.63184.9621.44
GPR-BAT0.65301.9520.810.67166.1519.260.62306.3021.110.64175.5620.35
Table 5. Modeling and verification accuracies of estimating AGB based on FDS by PLSR and GPR