1Institute of Micro/Nano Photonic Materials and Applications, School of Physics and Electronics, Henan University, Kaifeng 475004, China
2Key Laboratory of Infrared Imaging Materials and Detectors, Shanghai Institute of Technical Physics, Chinese Academy of Sciences, Shanghai 200083, China
Oxygen-containing defects are very important for altering the nonlinear optical (NLO) properties of graphene. To investigate the correlation between oxygen-containing defects and the synergistic NLO response in graphene-based nanocomposites, we attached CdS nanocrystals on the surface of graphene (G) and prepared G/CdS nanohybrids (NHs) consisting of various oxygen-containing functional groups via a chemical method. The NLO absorption and refraction of G/CdS NHs under single pulse laser irradiation are enhanced by 10.8 times with the concentration decrease of surface oxygen-containing groups, which might be attributed to the local field effects and synergetic effects stemming from charge transfer between the two components. However, the optical nonlinearity is decreased with further concentration decrease, which might arise from fragment interconnection and surface defects in the NHs. The NLO absorption transformation from two-photon absorption to saturable absorption with oxygen decrease is observed, and intensity-related NLO absorption and refraction in NHs are also discussed. Meanwhile, the G/CdS NHs exhibit superior NLO properties, implying potential applications of NH material in NLO devices.
1. INTRODUCTION
Recently, graphene-based nanohybrids (NHs), because of their enhanced nonlinear optical (NLO) properties, have attracted much attention for fundamental investigations and technological applications for a variety of important photonic devices, including optical switching, information storage, and optical signal processing [1–3]. It has been found that NLO performance is increased in various NHs as compared with pristine graphene (G), and different physical effects are proposed. Covalently linked G/Zn porphyrin composite was observed to have 2 times enhanced NLO susceptibility compared to graphene, which was attributed to the improved excited state absorption (ESA) and nonlinear scattering by energy transfer between porphyrin and graphene [4]. Graphene oxide (GO)/Pt complex hybrids possessed 8 times larger NLO susceptibility than individual GO, owing to not only a combination of nonlinear scattering, nonlinear absorption, and photoinduced electron and energy transfer between GO and Pt complexes, but also the way by which they are combined [5]. The NLO performance enhancement of GO/Zn phthalocyanine was rationalized in terms of peripheral substituents with a strong electron-donating effect [6]. Enhanced NLO properties of GO/Ag nanocomposites were attributed to surface plasmon resonance at low laser intensities and excited state transition at higher intensities [7]. A G/ZnO hybrid also showed excellent NLO properties compared to its individual counterparts, due to two-photon absorption (2PA) with reverse saturable absorption (RSA) and photoinduced photon transfer between ZnO and graphene [8,9]. In the case of nanocrystal (NC)-linked graphene nanocomposites, exhibited an increase in nonlinear absorption by a combination of NLO absorption mechanisms and NLO scattering [10]. It was also suggested that the nanoparticle concentration, which could be modified by the added content, might contribute to the improved optical nonlinearity in -. NLO absorption and scattering were proposed to explain the enhanced nonlinearity in graphene nanocomposites [11].
Surface defects on nanomaterials also play an important role in optical nonlinearity owing to a large surface-to-volume ratio in the nanomaterials [12,13]. Our recent study indicated that nonradiative surface defects could significantly decrease the NLO response of G/CdS nanohybrids, which resulted in limited improvement within 1 order of magnitude [14]. Surface defects can be modified by covering the G/CdS nanohybrids with oxygen-containing groups, so it is convenient to study how defects enhance optical nonlinearity by using chemical reduction. Furthermore, most of the NLO studies on graphene-based NHs use nanosecond laser pulses as the excitation source, where the NLO mechanism is more easily recovered by thermal scattering relative to the environment than by intrinsic absorption. However, comparably few studies have been carried out with a single pulse picosecond (ps) laser, which is much shorter than a nanosecond and could more clearly demonstrate the intrinsic property. Therefore, it is essential to deepen the understanding of the NLO performance of this covalent system by ps single pulses.
In this paper, our aim is to discuss the relationship between oxygen-containing defects and linear and nonlinear optical properties. A graphene surface was covered by oxygen groups, and the single pulse NLO absorption and refraction in colloidal G/CdS nanohybrids with different oxygen content were investigated by ps laser pulses at 532 nm. We selected 532 nm as the laser wavelength because the optical nonlinearity of graphene-based composites in the visible was larger than that in the near-infrared [15]. The experimental results show an enhancement of 10.8 times with the increase of oxygen but a weakness with the further increase. We discuss the mechanisms behind the NLO behavior of G/CdS NHs in the context of our observations.
Sign up for Photonics Research TOC. Get the latest issue of Photonics Research delivered right to you!Sign up now
2. EXPERIMENTS
A. Sample Preparation
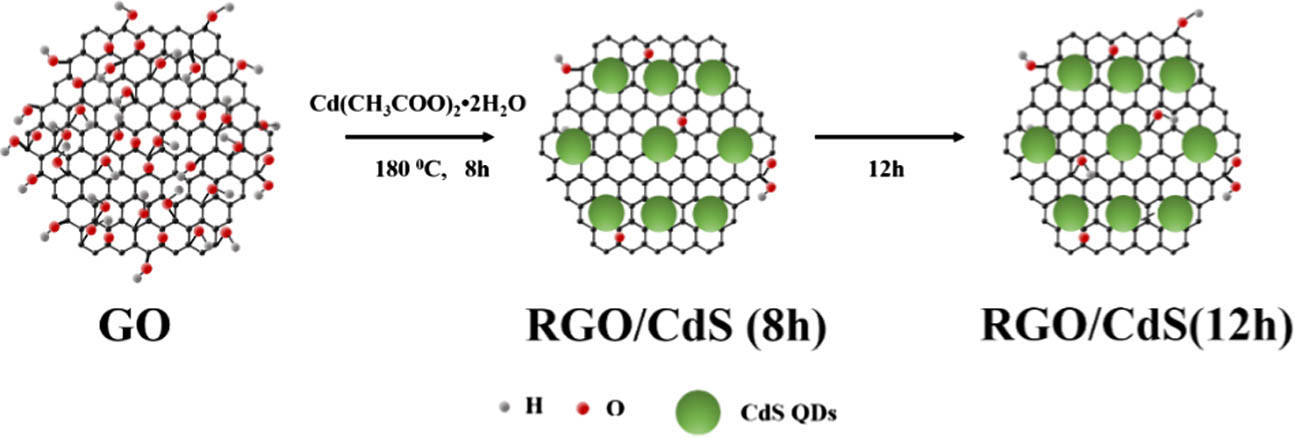
GO nanosheets are prepared from purified natural graphite powder by the improved Hummers’ method [16], and G/CdS nanohybrids are prepared by a thermochemical method as described in Ref. [17]. The synthesis procedure of the G/CdS NHs is depicted in Fig. 1.
Figure 1.Schematic illustration of the synthesis procedure of G/CdS NHs.
First, stacked graphite is oxidized to graphene oxide by and 98% , which contains some oxygen-containing functional groups, for example, carboxyl, epoxide, and hydroxide. The functional groups on the GO provide reactive anchoring sites for nucleation and growth of nanocrystals. The GO nanosheets (40 mg) are ultrasonically dispersed in dimethyl sulphoxide (DMSO, 40 mL) to obtain a stable GO suspension. This improved method greatly increases the efficiency of oxidizing graphite to graphene oxide and also prevents the formation of toxic gases as compared to Hummers’ method. The prepared graphene oxide is more oxidized and also possesses a more regular structure. This improved synthesis of GO might be important for large-scale production of GO, as well as the construction of devices composed of graphene.
Second, (100 mg) is added into the suspension. After vigorous stirring, the solution is transferred into a Teflon-lined stainless steel autoclave (20 mL) and reacts under 180°C. Then the CdS nanocrystallization of the coating materials on graphene in the anatase phase is facilitated. The oxygenated groups of GO were removed by the OH radicals dissociated from alcohol molecules of hydrazine monohydrate at high temperature. The reduction with hydrazine eliminates most oxygen-containing functional groups of GO and partially restores the -electron conjugation within the aromatic system of graphite. As a result, the reduced GO is usually precipitated from the reaction medium because of the increased hydrophobic property and -stacking interaction by the recovered graphite domains of graphene nanosheets. When the reaction time reaches 2 h, the solution is taken out and washed to remove non-reacting reactants and CdS nanocrystals not bonded to the graphene sheets. The product is centrifuged and dried in a vacuum drier and is labeled Sample 1 (S1). The above experimental steps are performed for reaction times of 4, 6, 8, 10, and 12 h, thus obtaining another five samples, which are labeled Sample 2 (S2), Sample 3 (S3), Sample 4 (S4), Sample 5 (S5), and Sample 6 (S6).
B. Instrumental Characterization
Fourier transform infrared (FTIR) spectra were taken with a FTIR VERTEX 70v (Bruker Optics Corp.). Transmission electron microscopy (TEM) images were captured with the use of a Jeol JEM-2100 transmission electron microscope. UV-Vis spectra were recorded on a PerkinElmer Lambda 35 UV-Vis spectrometer. Photoluminance (PL) spectra were recorded on a PerkinElmer LS 55 luminescence spectrometer. Energy dispersive X-ray spectroscopy (EDX) was carried out by a Hitachi JEOLJSM-7001F EDX spectrometer. X-ray diffraction (XRD) patterns were monitored by a DX-2700 diffractometer (Dandong Haoyuan Instrument Co., Ltd.). Raman spectra were taken on a Renishaw RM-1000 laser Raman microscope system.
The laser source used for the NLO measurement is a Nd:YAG laser system (EKSPLA, PL2251), which produces 30 ps laser pulses at the 532 nm wavelength with a 1 Hz repetition rate. The spatial distribution of the laser pulses exhibits a nearly Gaussian profile. The input and output energies of the single laser pulses were recorded with a dual detector energy meter that was connected to a computer. The samples investigated were taken as solutions in dimethylformamide (DMF) for the experimental studies, which were filled in a 1 mm long quartz cell, and the “thin sample” approximation was satisfied comfortably. The cuvette is mounted on a mobile platform controlled by a computer that moves the sample along the axis and through the focal plane of a 250 mm focal length lens. The beam waist radius at the focal plane is approximately 10.6 μm. The input single pulse intensity at the focal plane is adjusted to be , in order to be lower than the damage threshold of the samples, which was testified by the same optical spectra measured before and after the laser radiation. The transmittance was then measured as a function of laser incident fluence. The Z-scan technique can simultaneously measure nonlinear optical absorption and nonlinear optical refraction utilizing a single Gaussian beam. In this technique, the sample is scanned along the axis of a focusing beam, while the transmittance through an aperture in the far field is measured. As NLO refraction results in self-lensing, which causes changes in the far-field beam radius, the aperture transmittance is sensitive to NLO refraction [“closed-aperture” (CA)]. Z-scan measurement with removal of the aperture called “open aperture” (OA) is sensitive only to NLO absorption. When NLO absorption coexists with NLO refraction, the CA Z-scan exhibits features of both CA and OA. In the case of dividing OA from CA (CA/OA), the transmittance change by the amplitude of phase shift and pure NLO refraction is obtained.
3. RESULTS AND DISCUSSION
A. Change Characterization of Oxygen-Containing Content and Defects
The FTIR spectra provide more information about the formation of G/CdS nanohybrids and the evolution of domains in them with various oxygen-containing group amounts. Figure 2 shows the typical FTIR spectra of G/CdS. As one can see, the peaks at 3423, 1559, 1218, and , which correspond to the stretching vibration of , , , and , respectively, are the characteristic peaks of the carboxyl and hydroxyl groups generated during the GO preparation [3]. After conversion of GO into graphene from S1 to S6, the peak disappears and the is weakened, resulting in the increase of coordination interaction between CdS and graphene. All of the bands, which are related with the oxygen-containing functional groups, decrease dramatically in intensity after solvothermal reduction, consistent with conversion of GO into graphene with various oxygen-containing groups. This indicates the formation of larger domains and also the smaller fragments between the larger domains.
Figure 2.Typical FTIR spectra of S1, S2, S4, and S6.
The confirmation of size evolution of domains with transition from GO to G/CdS with various oxygen-containing functional groups is obtained by X-ray photoelectron spectroscopy (XPS) profiles. The typical XPS of S1 is shown in Fig. 3(a). The XPS profiles have been fitted with sub-peaks of the corresponding functional groups of , , , , and . GO has five XPS absorption peaks—284.6, 285.7, 286.4, 286.9. and 288.6 eV—corresponding to binding, the binding, the binding, the binding, and the binding. The typical variations of C 1s and O 1s of S1, S4, and S6 are provided in Figs. 3(b) and 3(c), respectively. The percentage area of each binding energy corresponding peak and the calculated O/C ratio for all these six samples are listed in Fig. 3(d). One can see that oxygen-containing groups in G/CdS are removed gradually, to an increasing degree as larger doses of hydrazine hydrate are used, indicating that the size of domains increases and small fragments between large domains might be formed. When the reduction time is increased to 14 h and longer, the O/C ratio is increased slowly, suggesting that the reduction influence on G/CdS NHs becomes moderate. The increase of oxygen-containing defects might result mainly from the interaction between graphene sheets and CdS NCs and the presence of unrepaired defects [18].
Figure 3.Typical XPS spectra of (a) S1, (b) typical C 1s, and (c) O 1s. (d) Ratio of O and C of the samples.
The growth of CdS NCs with the formation of G/CdS NHs and indirect evidence for the interactions between graphene nanosheets and CdS nanocrystals can be obtained from TEM images. The typical TEM images of S1 and S5 are shown in Figs. 4(a) and 4(b), respectively. The sheet surface of the pristine graphene is smooth. After modification with CdS NCs, the graphene nanosheet surfaces became clearly rougher, while the intrinsic quality of the sheet structures was maintained, and new species, corresponding to CdS NCs, could be observed. It can be seen that CdS NCs prefer surface defect sites of graphene. The inset of Fig. 4(a) shows the high-resolution TEM image of CdS. It is obtained that CdS NCs with a diameter of about 6.9 nm are uniformly distributed on the graphene surface. The lattice fringes of individual CdS NCs with a spacing of 0.336 nm in the high-resolution TEM (HRTEM) image can be assigned to the (111) lattice planes of cubic CdS. The selected area electron diffraction pattern in the inset of Fig. 4(a) reveals the single crystal nature of graphene. To understand the density of CdS NCs, EDX spectra of the samples were recorded. The typical spectra of S1 and S6 are shown in Figs. 4(c) and 4(d), respectively. The spectra clearly detail the weight percent (wt. %) of cadmium to be 6.65% for S2 and 6.77% for S6, suggesting that the average density of CdS NCs is similar in G/CdS NHs.
Figure 4.TEM images of (a) S1 and (b) S5. HRTEM image of CdS [inset of (a)]. EDX spectra of (c) S2 and (d) S6.
To confirm the defects of G/CdS NHs, the samples were subjected to the wide-angle powder XRD, as shown in Fig. 5. An intensity shifting of XRD patterns toward larger angles as the increase of reduction level appears, which indicates the decrease in lattice parameter, confirming the decrease of oxygen-containing groups in G/CdS NH with reduction level increase. The best structure with the fewest defects appears for S4 arising from the best XRD pattern, suggesting the fewest defects due to the lowest oxygen-containing groups. The three main diffraction peaks of CdS were broadened for S5 and S6, indicating defect increase with the growth of oxygen-containing groups. Furthermore, the XRD pattern of GO with a single peak at around 10.2° corresponds to a (002) plane and a spacing of 0.83 nm, which matches well with the values in the earlier literature. After attaching CdS nanocrystals on the surface of graphene, the (002) plane disappears, indicating a complete exfoliation of GO in the NHs. There are three main diffraction peaks of CdS in the XRD patterns at , 44.0°, and 52.1° [indexed to be (111), (220), and (311)], which are in good agreement with the standard values in the standard card of CdS (JCPDS PDF 80-0019). All the XRD patterns of G/CdS hybrids with various reduction levels as shown in Fig. 5 have similar characteristics, indicating that CdS decorated on graphene is of a cubic zinc-blende structure. The average size of the CdS nanocrystals on the surface of graphene, which was calculated by the Debye–Scherrer equation based on the full width at half-maximum of the diffraction peaks, is 6.6 nm. This result is consistent with the value obtained by TEM images.
The density of oxygen-containing defects in G/CdS NHs can be obtained by the Raman spectra. Graphene exhibits the characteristic D and G bands at 1330 and , respectively. The G band arises from the in-plane vibrations of the graphitic carbon atoms, whereas the D band originates from defects in the graphene plane and G/CdS. Figure 6(a) shows a small-intensity D band and a sharp and intense G band for GO, which indicates a highly ordered, less defective, and crystalline GO sample. The peak intensity ratio of the D band and G band () of samples is calculated to be 1.21, 1.06, and 1.08 for samples S1, S4, and S6, respectively. G/CdS exhibits a slight decrease in the ratio with reduction treatment (from S1 to S4), indicating the presence of fewer defects as a result of the decrease of oxygen-containing groups, while a slight decrease of (from S4 to S6) indicates a slight increase of oxygen-containing groups. Since the G band localizes at and the NHs are disordered by oxygen-containing groups with an ratio from 1.21 to 1.06, there should be a small content in G/CdS [19]. In this case, the average cluster size or an effective in-plane correlation length of region dimension is given by [19,20], where is the excitation laser wavelength (632.8 nm). The region dimensions of S1, S4, and S6 are 15.4, 16.5, and 16.3 nm, respectively. The defect density can be approximately evaluated by [20], and the results are given in Fig. 6(b). The defect density is lessened with oxygen-containing groups decreasing (S1–S4), but slightly increased with oxygen-containing groups increasing (S5, S6), which coincides with the variation of oxygen-containing content confirmed by FTIR, XPS, and XRD.
Figure 6.(a) Raman spectra and (b) of the samples.
B. Oxygen-Containing-Defect-Induced Synergetic Linear Optical Effect in NHs
The oxygen-containing-defect-induced synergetic effect on the linear optical properties of G/CdS NHs is embodied in the linear absorption measurement spectra. As shown in Fig. 7(a), GO has an absorption peak at 235 nm, which is assigned to a − transition of sites, and a shoulder peak at around 305 nm, which is due to a − transition. GO and graphene exhibit broadband absorption, ranging from ultraviolet to near-infrared. CdS exhibits a strong exciton absorption peak at 467 nm, and G/CdS (S6) displays an exciton absorption peak at 485 nm. A 10 nm redshift suggests the covalent attachment of CdS on graphene with some alteration of the electronic state of CdS. Figure 7(b) shows the absorption spectra of graphene with various oxygen-containing groups. S1 does not display an obvious absorption peak, while sample S2 exhibits an exciton absorption peak at 476 nm. A 9 nm redshift from S2 to S6 indicates that the energy gaps between the and states of G/CdS NHs generally depend on the size of clusters. The absorbance is found to increase with hydrazine exposure time, consistent with the evolution of oxygen and a concomitant increase in the fraction and the decrease in the concentration of carboxyl groups.
Figure 7.(a) Absorption spectra of S6 compared with CdS and graphene. (b) Typical absorption spectra of the samples.
C. Oxygen-Containing-Defect-Induced Synergetic NLO Performance in NHs
The synergetic effect on the NLO properties of G/CdS NH samples has been investigated by the Z-scan technique with a single pulse laser. To more precisely identify the alignment of the ps Z-scan setup, carbon disulfide () solution was used as a benchmark for calibration. The third-order NLO refractive index of is measured to be , very close to the standard value of , which demonstrates the reliability of the Z-scan measurement platform.
In Fig. 8(a), some typical OA Z-scans of G, CdS, and G/CdS NHs (S6) are presented, as obtained under 532 nm laser excitation at an intensity of with a concentration of 0.21 mg/mL. Since DMF exhibits little NLO absorption under ps 532 nm excitation, which can be ignored in comparison with the samples’ absorption, the obtained Z-scans reveal straightforwardly the response of graphene and G/CdS. As can be seen, it is found to exhibit a symmetrical peak for graphene nanosheets, a valley for CdS nanocrystals, and a valley within the peak at the focus for G/CdS NHs, indicating that saturable absorption (SA), 2PA, and 2PA following SA might dominate the NLO absorption mechanism of graphene, CdS, and G/CdS, respectively. In Fig. 8(b), typical OA Z-scans corresponding to aqueous dispersions of G/CdS nanocomposites with various oxygen-containing functional groups are given. As shown, G/CdS samples exhibit similar NLO absorption to graphene with SA at the focus. The peak tends to heighten with the reduction increasing to S4, while the valley within the peak appears and deepens with further reduction. To better understand our Z-scan experimental results, we consider SA and 2PA simultaneously. We use the beam propagating expression from Maxwell’s equations to describe the propagation of the electrical field, [21], where a combination of SA coefficient and 2PA coefficient was used for the total NLO absorption coefficient as . Following this procedure, the OA Z-scan measurements have been fitted and the parameters and have been determined. The imaginary part () of the third-order susceptibility is then calculated by [22], where is the speed of light, is the linear refractive index, and is the frequency of the input light.
Figure 8.Measured OA Z-scan traces of (a) S6, CdS, and graphene and (b) S3, S4, and S6. (c) The typical of S6 as a function of intensity. (d) Typical CA Z-scan traces of S6, CdS, graphene, and DMF. The red solid lines in (a) and (d) are the fitting curves by NLO absorption and refraction Z-scan theoretical formulas, respectively.
Both SA and RSA originate from an ESA process. ESA involves sequential absorption of two or more photons, while 2PA involves simultaneous absorption of two photons. ESA and 2PA can be distinguished by measuring the intensity dependence of the NLO absorption coefficient . To illustrate the mechanism of NLO absorption, the NLO absorption coefficient as a function of input intensities is given in Fig. 8(c). With the increase in input intensity, the value of S6 stays almost constant at 6.67 cm/GW, indicating that 2PA dominates the NLO absorption behavior of G/CdS NHs. With increase in the input fluence to , a transition from the transmission peak to the transmission dip can be observed. The observed SA of G/CdS NHs at the low input intensity can be attributed to the ground-state bleaching of the domains, which has a narrow energy gap of 0.5 eV, and the depletion of the valence band and filling of the conduction band can be easily induced [23]. As the input intensity increases, the 2PA and ESA of the matrix are the mechanisms responsible for the observed NLO behaviors. The transition from the SA to the RSA or 2PA has previously been reported for carbon-based materials including GO and graphene [14,21,24]. The NLO absorption coefficient is found to change from negative to positive [21], corresponding to the transition from SA to RSA or 2PA as the excitation fluence increases.
This NLO absorption mechanism is relative with the structure and energy gap of G/CdS NHs. The energy gap of graphene between the and states generally relies on the size of clusters or conjugation length. clusters with diameters of about 3 nm have energy gaps of around 0.5 eV from calculations based on Gaussian and time-dependent density functional theory [23], which can be responsible for the SA observed here. A single benzene ring has a bandgap of about 7 eV, and a cluster of 20 aromatic rings has a bandgap of about 2 eV [23], which can result in the 2PA and multi-photon absorption process in optical nonlinearity. The observed 2PA may be attributed to the much smaller clusters of a few aromatic rings or of some other configurations of similar size. The increased concentration of such fragments is likely to be responsible for the observed increase in the optical nonlinearity during the initial reduction. Furthermore, the NLO decrease with longer reduction may result from percolation among these configurations, facilitating transport of excitons to nonradiative recombination sites.
To find the NLO refraction coefficient and the real part of the NLO susceptibility we performed CA Z-scan measurement. The CA/OA Z-scan traces are depicted in Fig. 8(d). A positive nonlinear refractive index for graphene nanosheets, CdS NCs, and G/CdS NHs corresponding to self-focusing has been deduced from Z-scans. In Fig. 8(d), the black dots are the experimental points and the solid line is the theoretical fitting by the following relation: [12], where is the laser wavelength, is the linear absorption coefficient, is the difference between the peak and the valley of the normalized transmission of the CA/OA Z-scan trace, and S is the transmittance of the aperture, defined as , with being the radius of the aperture and denoting the beam radius on the aperture. The real part of the NLO susceptibility is deduced by the following relation: [22].
For CA/OA Z-scan experiments, the NLO refraction of the solvent DMF cannot be ignored due to the strong on-axis intensity on the sample. As shown in Fig. 8(d), DMF and the G/CdS dispersion with various oxygen-containing functional groups show positive NLO refraction behavior. Therefore, the NLO refraction index for the dispersion can be expressed as , where and are the NLO refractive indices of G/CdS samples and DMF, respectively. By fitting the CA/OA Z-scan traces, and are obtained, and the NLO refractive index of G/CdS NHs can be deduced. Accordingly, the values of G/CdS can be depicted, as in Fig. 9. Comparing the OA Z-scan traces with CA Z-scan curves, the G/CdS NHs maintain positive NLO refraction behavior through the NLO absorption transition from SA to RSA.
Figure 9. (red), (blue), and (black) plots of these six samples. The inset shows alone to illustrate its variation clearly.
From fitting the Z-scan curves, the and values of graphene, CdS, and G/CdS are also extracted. The values of graphene and G/CdS (S4) are and , respectively. Thus, a 17.5 times increase in third-order nonlinear susceptibility of G/CdS nanocomposite in comparison with that of graphene has been observed after attachment of CdS nanocrystals. It is obvious that with the functionalization of CdS NCs, a 17.5 times synergistic improvement is obtained. The dependence of , , and values of G/CdS on the oxygen-containing groups is summarized in Fig. 9. The values of G/CdS NHs are observed to be 1 order of magnitude smaller than the imaginary part. This implies that the real part of G/CdS NHs in solution does not significantly contribute to the total optical nonlinearity. In other words, of our samples can be assumed to be approximately equal to the value of . As the oxygen-containing functional groups are increased toward S4, , , and are dramatically increased but released when the oxygen-containing groups are increased further. The of the G/CdS nanocomposites (S4) is 10.8 times larger than that of S1, indicating that a 10.8 times synergistic enhancement is achieved after the surface defects of G/CdS NHs are altered by oxygen-containing functional groups, providing excellent NLO properties for potential optical applications by tuning the surface structure of G/CdS NHs.
The NLO absorption coefficient can also be obtained by measuring the NLO transmission as a function of the input intensity [13]. Samples with density of 1.82 mg/mL were put in a 10 mm pathlength quartz cuvette during the NLO transmission measurement. A typical NLO transmission spectrum of S2 is given in Fig. 10. By fitting these data with the theoretical equation, the 2PA coefficients are obtained to be 2.28, 2.83, 4.21, 22.1, 13.4, and 6.6 cm/GW for samples S1, S2, S3, S4, S5, and S6, respectively. Comparing these values with the 2PA coefficients obtained by Z-scans of 2.31, 2.82, 4.19, 21.85, 13.66, and 6.67 cm/GW, the values from the two measurement techniques are consistent, which confirms the results of our Z-scans.
Figure 10.Typical NLO transmission spectrum (S2). The red solid line is the theoretical fitting curve.
The 2PA coefficient, obtained by fitting the Z-scan traces, is 2.31 cm/GW for sample S1. The obtained value is comparable with the reported value of G/ZnO (5.8 cm/GW) [8], but smaller than that of G/CdS composites (354 cm/GW) [25] and G/ZnO composites (199 cm/GW) [9]. The reason might be that the latter NLO behavior is related to the nonlinear scattering in their environment, which is absent in our experiment. When the surface defect is tuned by oxygen-containing groups, the 2PA coefficient increases to 21.85 cm/GW (S4), indicating the important effect of surface oxygen-containing defects on the optical nonlinearity of graphene-based nanocomposites. Furthermore, the reduction-dependent trend in the present work not only provides an insight into the reduced graphene-based nanocomposites, but also suggests that chemical engineering techniques may be useful to result in tuning the optical nonlinearity of various nanomaterials, which is important for potential application in optoelectronic devices.
For graphene, the interband transition of electronic structures plays an important role for the SA. The SA of graphene might be offset by the 2PA of CdS NCs and the photoinduced electron/energy transfer between them. The covalent attachment of CdS units is expected to facilitate the development of applications for chemical attachment to surfaces.
The dramatically enhanced optical nonlinearity of G/CdS NHs can be attributed to the notable extra synergetic effect between the two individual components, which mainly includes the effect of local field and charge transfer (CT). CdS NCs act as light active sites by absorbing incident photon and transfer electron/energy to the graphene substrate, which has a two-dimensional -electron conjugated structure with a large number of delocalized electrons, resulting in an enhancement of the NLO response in G/CdS NHs. The energy level of G/CdS composites is tuned by surface defects of the oxygen-containing groups. The conduction band (CB) bottom and valence band (VB) top of CdS are located at and , respectively [26]. A three-energy-level model is used for graphene [27]. When irradiated by stronger incident laser with a wavelength of 532 nm (1.92 eV), two-photon electrons in the CdS NCs will be excited and 2PA in graphene nanosheets will occur. Then, the electron on the CB of CdS NCs will relax to the state of graphene and then return to the state, followed by a fast spread to the surface of graphene. This extra electron transfer from CdS to graphene improves the NLO properties in G/CdS NHs. The donor–acceptor interaction between graphene and CdS includes an intersystem CT from the photoexcited CdS to graphene, resulting in fluorescence quenching and energy release. The effective CT was confirmed by absorption spectra of G/CdS NHs.
We have not found a theoretical calculation in the literature that can be used to directly describe the optical nonlinearity of our present composite system with various oxygen-containing functional groups. To make a qualitative explanation of our experimental results, we take into consideration a model used to treat a related composite system as simple guidance resulting from the synergistic effect between the two components.
We can first approximately consider the composite system as effective particles (CdS NCs) inside a dielectric host (GO nanosheets), in which the dielectric local field will affect the NLO susceptibility of the nanocomposites and the synergistic effect between the two components originates from photoinduced effective local electric field redistribution at the CdS and graphene surface in the presence of an external electric field [28]. The effective third-order NLO susceptibility is then given by the Maxwell–Garnet model that assumes spherical inclusion embedded in a continuous host medium as the relation of [28,29]where the first item is cooperative susceptibility () and the last item is synergistic susceptibility (). In this equation, represents the volume concentration of CdS NCs, and is the modification factor due to the local field of the involved dielectric medium in CdS NCs. and are the dielectric constants of the CdS NC inclusion and the GO nanosheet host, respectively. Given the CdS (7.6) [13] and GO (10.1) [30] dielectric constant and their susceptibilities ( for CdS and for GO), the value is calculated to be , and the value is deduced to be . The synergistic susceptibility is larger than the cooperative one, which is coincident with the experimental result. This displays that the mechanism of the synergistic local field effect is very important for the NLO increase in GO/CdS NHs. The value is deduced to be for GO/CdS nanosheets. This synergistic local field could be tuned by the conductivity between CdS and the GO host, the phase shift at the CdS surface, and the absorption in the host [14]. Oxygen-containing-defect modification by chemical reduction treatment on GO used in this work is an effective method to control the synergistic local field and the NLO enhancement in the third-order susceptibility of GO/CdS NHs. This could be certified by our experimental results on G/CdS NHs and the following theoretical value. We consider the composite system as the effective particles of CdS NCs inside graphene nanosheets with low oxygen-containing functional groups. The dielectric constant of graphene (19.3) [31] is used to evaluate the effective third-order NLO susceptibility. The value of G/CdS is calculated to be , which is 13.3 times larger than that of GO/CdS. This is coincident with the experimental results, displaying that the local field effect is an important mechanism for the NLO performance enhancement in G/CdS with various oxygen-containing functional groups. NLO performance enhancement of more than 1 order of magnitude might arise from a phase difference between the field inside CdS and graphene and the externally applied field, which corresponds to the local field factor [29]. A phase shift between the fields is caused by the transmitted electric field for light incident upon an imperfectly conducting surface and depends on its polarization, the conductivity of the surface, and the absorption in the surrounding host medium. The absorption in graphene and the connectivity between graphene and CdS determine the conductivity in G/CdS NHs and also determine the phase shift at the conducting surface. Hence, changing the graphene absorption and increasing the conductivity of the graphene surface by moving off the oxygen-containing groups can affect the phase shift, which results in the value of the local field factor and NLO susceptibility.
The NLO performance enhancement of NHs may also result from the additional synergistic effect that comes from an intersystem CT crossing between graphene and CdS [15]. The CT exciton transition is certified by the OA Z-scan curves of G/CdS NH at various incident intensities. Figure 11(a) gives the typical OA Z-scans of S6 with various intensities. At a low intensity of , the hybrid has a symmetrical peak curve corresponding to SA. With the intensity increasing to , at the focus a valley appears within the peak and is deepened gradually, which proves the existence of CT between the two individual components. More OA Z-scan traces of all the samples with intensities of and are given in Figs. 11(b) and 11(c), respectively. The intensities at which the valley appears are 4.2, 5.1, 6.6, 7.4, 6.6, and for samples S1, S2, S3, S4, S5, and S6, respectively. The intensity increases from to and then decreases to , implying the change of surface oxygen-containing defects. The CT development in NHs and the change in their oxygen-containing defects could be further qualified by the peak-to-valley development of OA Z-scan transmittance at varying input intensities, as shown in Fig. 11(d). In the figure, is the sum of the normalized value of the peak-to-1 () and 1-to-valley (). The NLO properties of NHs perform obvious growth at incident light intensity from to for S1, with the beginning of fluctuation up and down at low incident intensity, but flattening out at high input intensity. This evidences that more CT is processed through the interface within this intensity region, while few CTs are processed at intensity higher than this region and no obvious CT is observed at intensity lower than this region. This intensity region is from 5.1 to 6.1 for S2, 6.6 to for S3, 7.6 to for S4, 6.6 to for S5, and 5.1 to for S6, respectively. The intensity region value and the valley appearance intensity are depicted in Fig. 11(e). The trend of the intensity region value fluctuates from S1 to S6, proving the transformation on the surface oxygen-containing defects of G/CdS NHs.
Figure 11.(a) OA Z-scan curves of S6 at 4.2, 5.6, and . OA Z-scan curves of the six samples at (b) and (c) . (d) Typical plots of S2 and S4. (e) The intensity region value and the valley appearance intensity of the samples.
A PL experiment is such a sensitive technique to investigate the electron donor–acceptor interaction that it can be used to testify the synergistic CT direction and transfer from to in NHs. Figure 12 shows the PL spectra of CdS, GO, and G/CdS. The PL peaks of CdS and GO are obtained at 490 and 433 nm, respectively, whereas G/CdS exhibits no PL peaks, implying that G/CdS undergoes fluorescence quenching. The effective fluorescence quenching is indicative of elective interaction from the excited state of CdS to graphene and the fast conduction by domains in graphene-like structures.
The decreased trend might be understood in the context of an amorphous structural model for GO nanosheets and G/CdS NHs with various fraction/oxygen-containing functional groups, since in carbon materials containing a mixture of and bonding, the optoelectronic properties are determined by the states of the sites [23,32,33]. A structure model of graphene anchored with CdS at different stages of reduction is proposed, as shown in Fig. 13. In this model, GO contains clusters, along with smaller configurations dispersed in an insulating matrix [Fig. 13(a)], where a large fraction of carbon is bonded with oxygen [23,33,34]. In the absence of a trapped electron–hole pair, the electron and hole wave functions have an overlap [Fig. 13(b)], reducing the oscillator strength of the exciton and the corresponding NLO susceptibility. Initially, the smaller domains have a low concentration, which results in moderate NLO polarization. With the removal of some oxygen with reduction, the larger domains do not change, while the concentration and size of the smaller domains or fragments increase [Fig. 13(c)]. The formation of new isolated smaller domains consisting of a few conjugated repeating units yields the increase of electron–hole pairs and the corresponding magnitude enhancement of the NLO polarization [Fig. 13(d)]. By continued reaction with further exposure to hydrazine hydrate, further removal of oxygen leads to percolation between the larger clusters via growth of smaller domains [Fig. 13(e)]. This reduces the spatial overlap of the electron and hole wave function and thus decreases the oscillator strength of the exciton [Fig. 13(f)] [12].
Figure 13.Structural models of G/CdS at different stages of reduction of (a) S2, (c) S4, (e) and S6. The dark gray areas represent carbon clusters and the dark blue small dots represent carbon bonded to oxygen groups. The light blue areas represent CdS NCs. The overlap of electron and hole of (b) S2, (d) S4, and (f) S6.
Transfer in graphene from matrix to domains and clusters directly influences CT between graphene nanosheets and CdS nanocrystals, since the localized states of domains and clusters are associated with the CT time and relaxation time in graphene [34]. The more localized states, the longer the CT time. Moreover, since the matrix acts as active sites for CdS attachment, a small quantity of matrices in G/CdS NHs is needed, and it might play a “bridge” role on the CT process between the two individuals [35]. Furthermore, the subsequent NLO performance decrease with longer reduction may be the result of percolation among these configurations, facilitating transport of excitons to nonradiative recombination sites. Our previous studies have proved that the nonradiative defects could rapidly quench surface-located electrons and thus reduce the NLO property [12–14,36].
4. SUMMARY
In summary, we have synthesized G/CdS NHs with various oxygen-containing functional groups and studied the relationship between the oxygen-containing defects and the NLO properties of the NHs under single pulse laser irradiation. It is found that G/CdS shows a gained NLO response with the initial decrease of oxygen-containing groups, while it shows a decrease with further reduction. The mechanism of the enhanced NLO behavior might arise from an efficient charge/energy transfer between the graphene and CdS, which enhances the local field effect between the two individual components. Furthermore, the synergetic susceptibility of G/CdS, which is tuned by surface oxygen-containing groups, is found to rise rapidly within a certain intensity, while it changes slowly with the intensity outside this region. The existence of oxygen-containing groups in G/CdS promotes the transform of the NLO signal from SA to RSA. The presence of isolated clusters within the carbon-oxygen matrix may lead to the localization of e-h pairs, facilitating NLO performance enhancement of small clusters. The NLO susceptibility is found to decrease with further reduction treatment, which is correlated to an increased amount of very small clusters and connections between them. Defects in NHs might also make the NLO weaken. Moreover, the hybrid shows good NLO response compared to graphene or CdS and can be remarkably tuned by surface oxygen-containing groups, which is an important method in designing optoelectronic devices through controlling the surface defects of 2D nanomaterials.