• Infrared and Laser Engineering
  • Vol. 49, Issue 8, 20190439 (2020)
Fajie Feng1, Yazhou Ding1, Junping Li1, Xingbei Huang2, and Xinyi Liu2、*
Author Affiliations
  • 1Power China Hubei Electric Engineering Corporation Limited, Wuhan 430040, China
  • 2School of Remote Sensing and Information Engineering, Wuhan University, Wuhan 430079, China
  • show less
    DOI: 10.3788/IRLA20190439 Cite this Article
    Fajie Feng, Yazhou Ding, Junping Li, Xingbei Huang, Xinyi Liu. Airborne LiDAR point cloud filtering using saliency division[J]. Infrared and Laser Engineering, 2020, 49(8): 20190439 Copy Citation Text show less
    Virtual grid
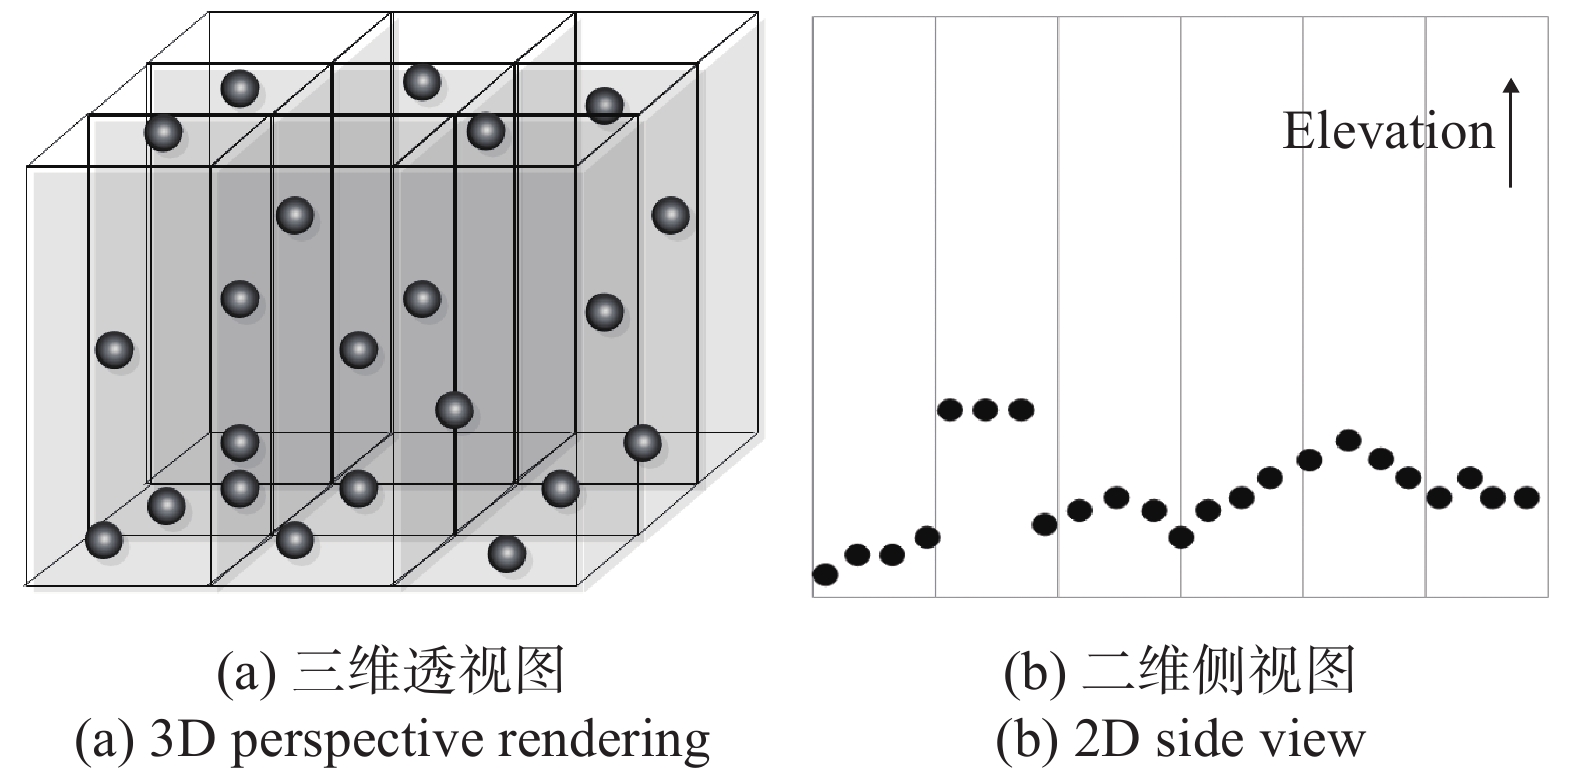
    Fig. 1. Virtual grid
    Elevation mutations detection in multiple directions
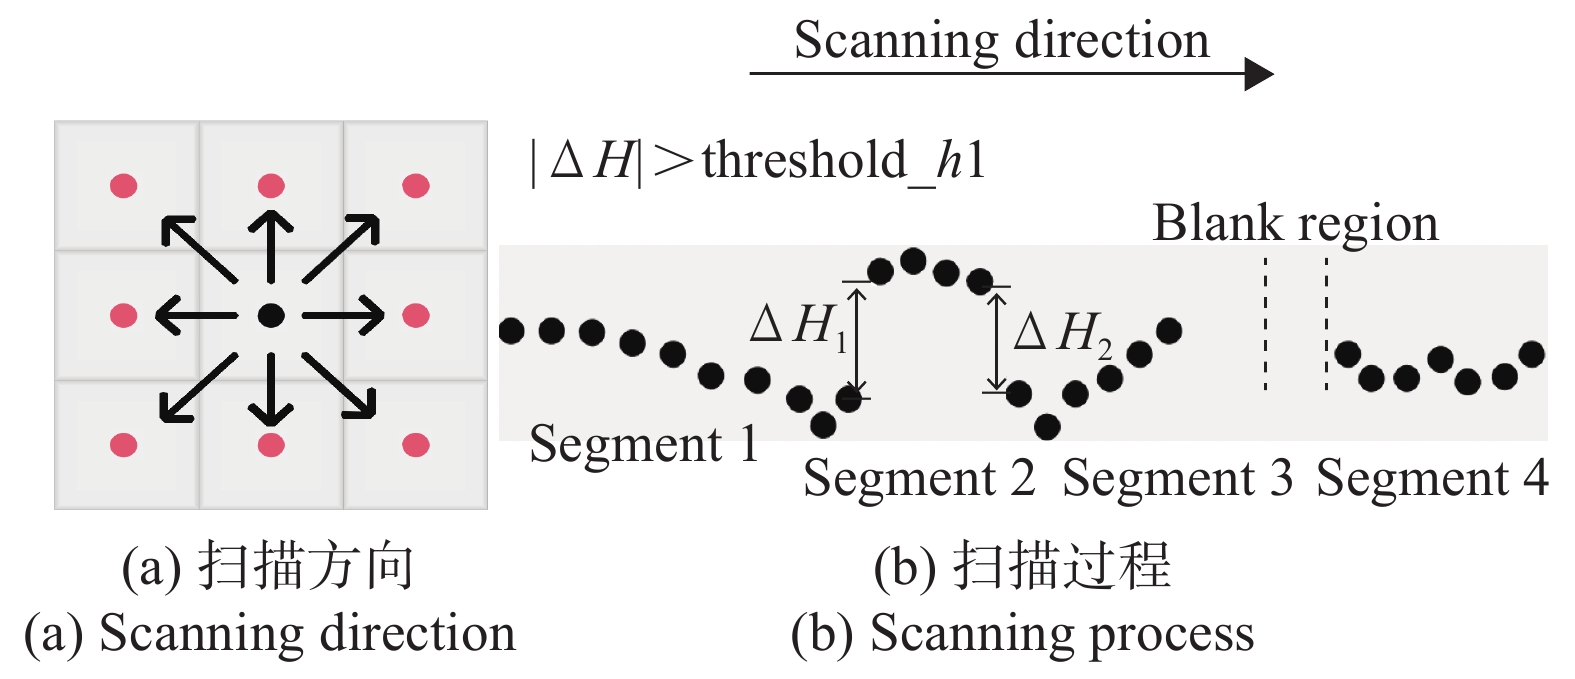
    Fig. 2. Elevation mutations detection in multiple directions
    Ground saliency calculating
    Fig. 3. Ground saliency calculating
    Layered map of point cloud elevation(a) and gray rendering map of ground saliency(b)
    Fig. 4. Layered map of point cloud elevation(a) and gray rendering map of ground saliency(b)
    Roofs of special shape building
    Fig. 5. Roofs of special shape building
    Ground saliency distribution of center sunken buildings area
    Fig. 6. Ground saliency distribution of center sunken buildings area
    Comparison of filtering result of site 1 and 9. (a) Filtering result of site 1; (b) original point clouds; (c) filtering result of site 9; (d) original point clouds
    Fig. 7. Comparison of filtering result of site 1 and 9. (a) Filtering result of site 1; (b) original point clouds; (c) filtering result of site 9; (d) original point clouds
    AreaTerrain properties
    Topographic reliefObjects
    1SmoothBuildings, vegetation, waterbody
    2SmoothComplicated buildings, vegetation
    3SmoothComplicated buildings, viaduct
    4SmoothComplicated buildings, vegetation
    5LargeBuildings, waterbody, terrain fault
    6LargeVegetation, buildings, viaduct
    7SmoothBuildings and vegetation
    8LargeBuildings, power line, viaduct
    9LargeSlope, vegetation, steep, viaduct
    Table 1.

    Landform in each subarea

    各子测区地形

    Data typeFiltering resultsSum
    GroundNon-ground
    Groundabe = a + b
    Non-groundcdf = c + d
    Sumg = a + ch = b + dn = e + f
    Table 2.

    Assessment criteria of crosstab method

    交叉表法评价指标

    γ1γ2Site1Site2
    E1 E2 Et E1 E2 Et
    0.3750.54.04.64.34.77.45.4
    0.3750.6254.04.74.44.87.45.5
    0.3750.754.04.74.45.07.35.7
    0.3750.8754.04.74.45.37.35.8
    0.50.6254.03.63.85.27.15.6
    0.50.754.03.63.85.37.05.8
    0.50.8754.03.63.85.57.05.9
    0.6250.754.03.33.66.36.36.3
    0.6250.8754.03.33.66.56.36.4
    0.750.8754.03.23.68.75.27.8
    Table 3.

    Error rate in different terrains using different threshold γ(%)

    在不同区域使用不同γ阈值的错误率(%)

    AreaPMPTDCSFProposed
    E1 E2 Et KE1 E2 Et KE1 E2 Et KE1 E2 Et K
    14.293.623.9392.093.455.494.5490.893.994.024.0090.634.003.153.5592.87
    25.657.576.7286.413.178.436.1187.686.066.466.2985.543.767.005.5788.75
    34.503.904.1991.602.014.273.1993.604.643.864.2390.973.613.123.3693.27
    46.776.016.3887.233.345.584.5090.994.676.815.7886.325.275.115.1989.61
    53.414.614.1990.903.804.474.2390.787.383.895.1188.763.313.963.7391.88
    66.583.994.8889.226.223.254.2790.532.925.254.4588.603.303.243.2692.82
    711.589.3510.6778.173.229.095.6288.293.6211.536.8683.624.9810.517.2484.93
    89.063.166.0587.892.854.353.6192.762.296.024.2090.033.113.303.2193.58
    96.813.344.7190.123.325.054.3790.934.9312.899.7479.372.535.704.4590.80
    Table 4.

    Comparison and analysis of filtering accuracy

    滤波精度对比分析

    Fajie Feng, Yazhou Ding, Junping Li, Xingbei Huang, Xinyi Liu. Airborne LiDAR point cloud filtering using saliency division[J]. Infrared and Laser Engineering, 2020, 49(8): 20190439
    Download Citation