
Qizhen Hou, Jingyan Sun, Hao Wang, Huiying Duan. Runway Edge Lights Brightness Detection Based on Improved RetinaNet[J]. Laser & Optoelectronics Progress, 2022, 59(2): 0210012
- Laser & Optoelectronics Progress
- Vol. 59, Issue 2, 0210012 (2022)
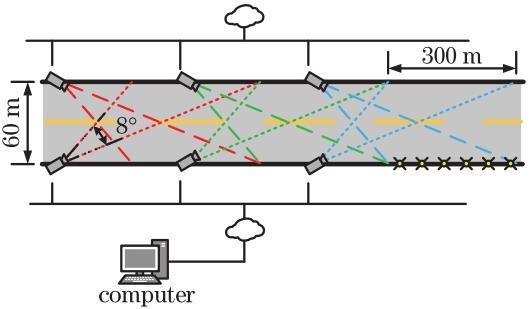
Fig. 1. Schematic diagram of image acquisition system for runway edge lights

Fig. 2. Structure of the RetinaNet
Fig. 3. Calculation process of standard convolution and depth separable convolution. (a) Standard convolution; (b) depthwise convolution; (c) pointwise convolution
Fig. 4. Structure of the linear inverted residual module. (a) Identity residual block; (b) convolutional residual block
Fig. 5. Structure of the FPN
Fig. 6. Data set image example. (a) Strong natural light image; (b) weak natural light image; (c) image without natural light; (d) image of 1-level light; (e) image of 2-level light; (f) image of 3-level light
Fig. 7. Runway edge light image after data enhancement
Fig. 8. Test results of the test set. (a) Image of 1-level light; (b) image of 2-level light; (c) image of 3-level light; (d) strong natural light image
Fig. 9. Images of runway edge lights with different focal lengths and weather conditions
Fig. 10. Detection results of different models on the same image. (a) Detection results of the model obtained from 3-level light image on 3-level light image; (b) detection results of the model obtained from 1-level light image on 3-level light image
|
Table 1. Calculation steps of the inverted residual module
|
Table 2. Structure of the improved feature extraction network
|
Table 3. Test results of different models on airport runway edge lights
|
Table 4. Test results of our method on different data sets

Set citation alerts for the article
Please enter your email address
© Copyright 2018-2021 | Chinese Laser Press. All Rights Reserved 沪ICP备15018463号-20