
Di Liu, Yingchun Li. Quality Assessment of Remote Sensing Images Based on Deep Learning and Human Visual System[J]. Laser & Optoelectronics Progress, 2019, 56(6): 061101
- Laser & Optoelectronics Progress
- Vol. 56, Issue 6, 061101 (2019)
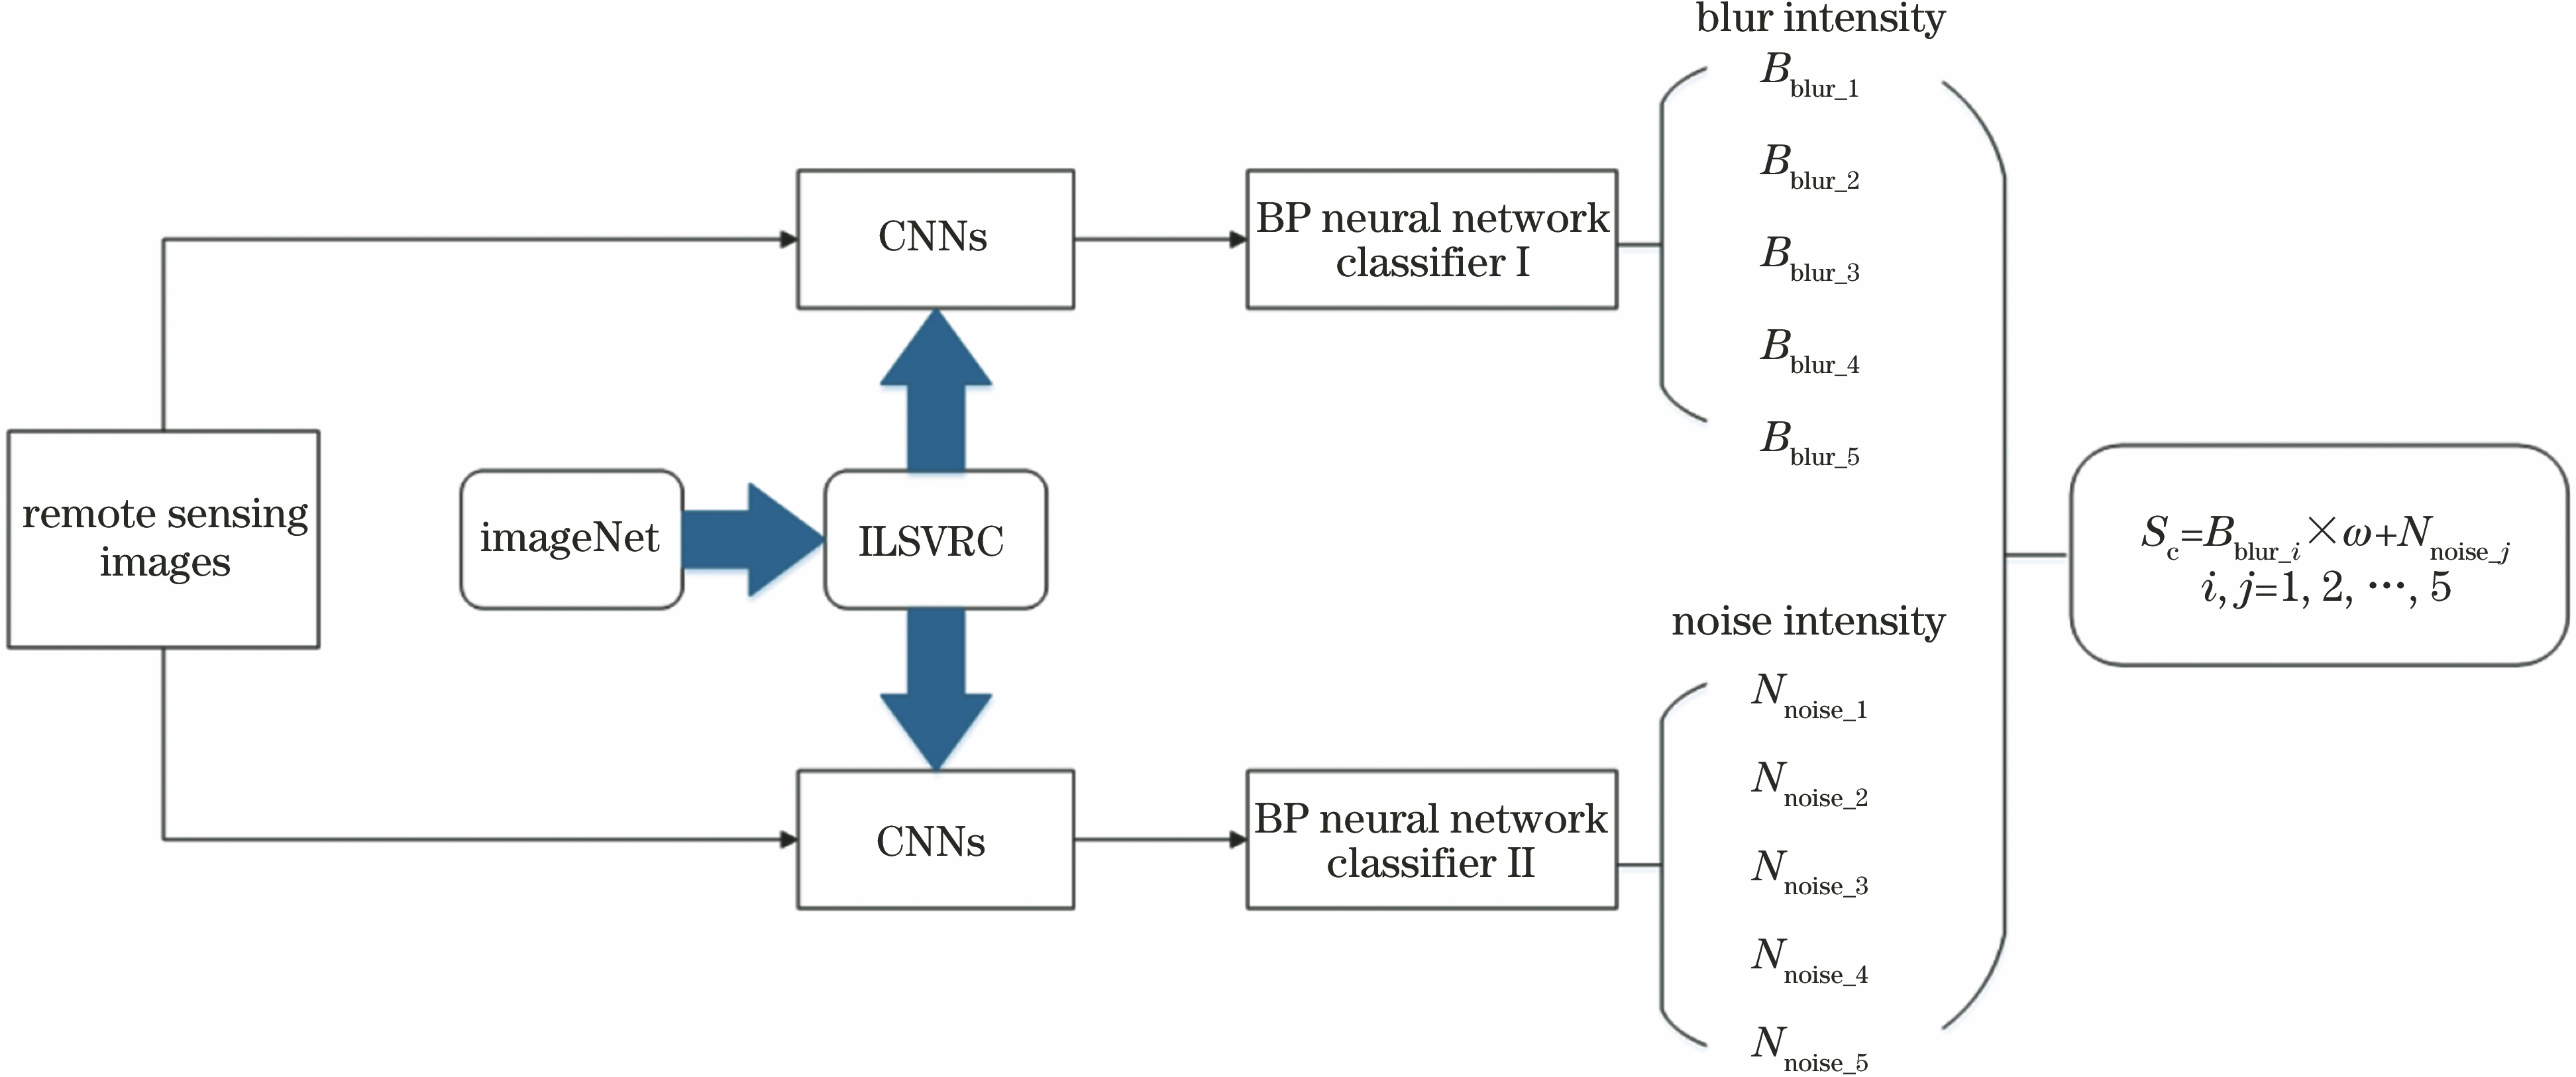
Fig. 1. Overall structure of assessment model
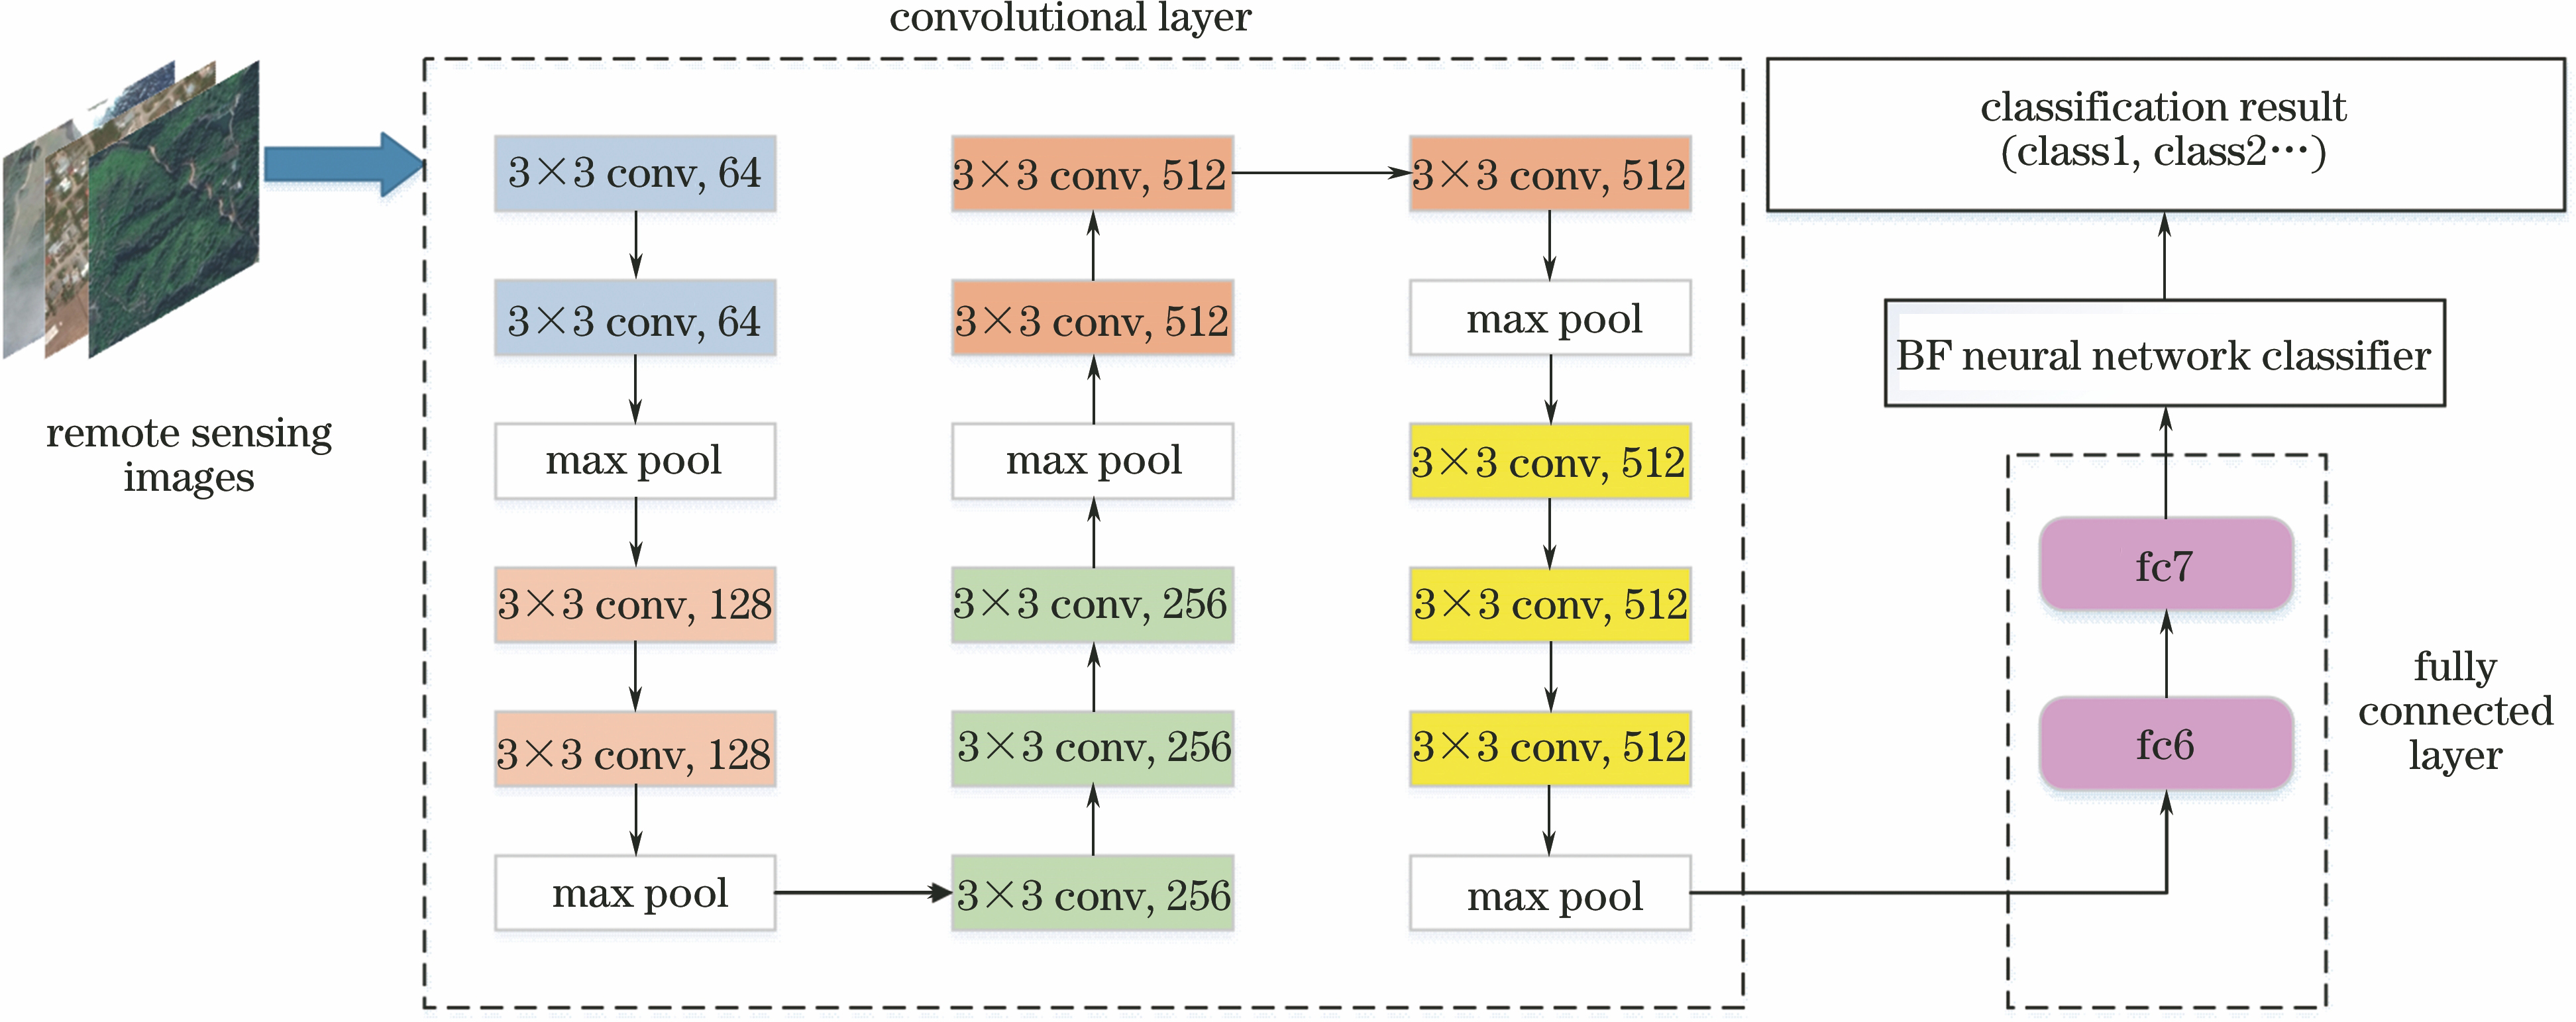
Fig. 2. Single-channel assessment framework based on parallel CNN
Fig. 3. VGG16 network structure
Fig. 4. Influences of blur and noise on visual characteristics of remote sensing images. (a) Original image; (b) image with noise; (c) image with noise once more; (d) image with blur; (e) image with blur once more
Fig. 5. Remote sensing images with different texture complexity. (a) S=9.2784; (b) S=23.1248; (c) S=19.0502; (d) S=14.9255; (e) S=20.1074; (f) S=13.2125; (g) S=23.2592; (h) S=18.7957
Fig. 6. Remote sensing images acquired by QuickBird-2 satellite. (a) Harbor; (b) vegetation; (c) road; (d) buildings
Fig. 7. Overall assessment results by proposed method
Fig. 8. Fitting scatter plot between proposed method and SSIM, PSNR, FSIM. (a) SSIM; (b) PSNR; (c) FSIM
Fig. 9. Fitting curves of DMOS for different assessment methods in LIVEMD dataset. (a) SSIM; (b) proposed method; (c) PSNR; (d) FSIM
|
Table 1. Blur level
|
Table 2. Noise level
|
Table 3. ITU-R quality and impairment scales
|
Table 4. Performance comparison of different methods
|
Table 5. Performance comparison of different methods in LIVEMD database

Set citation alerts for the article
Please enter your email address
© Copyright 2018-2021 | Chinese Laser Press. All Rights Reserved 沪ICP备15018463号-20