
Zhenyang Hui, Haiying Hu, Na Li, Zhuoxuan Li. Improved Alpha-shapes Building Profile Extraction Algorithm[J]. Laser & Optoelectronics Progress, 2022, 59(10): 1028006
- Laser & Optoelectronics Progress
- Vol. 59, Issue 10, 1028006 (2022)
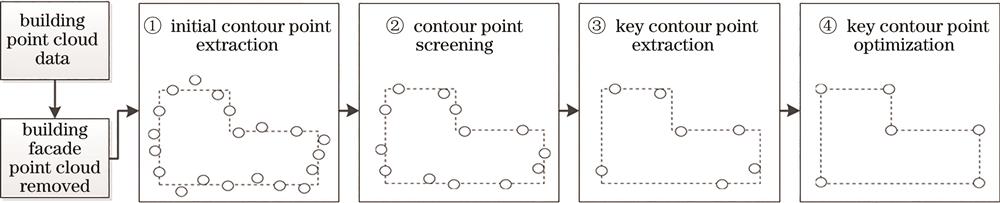
Fig. 1. Flow chart of the building profile extraction algorithm
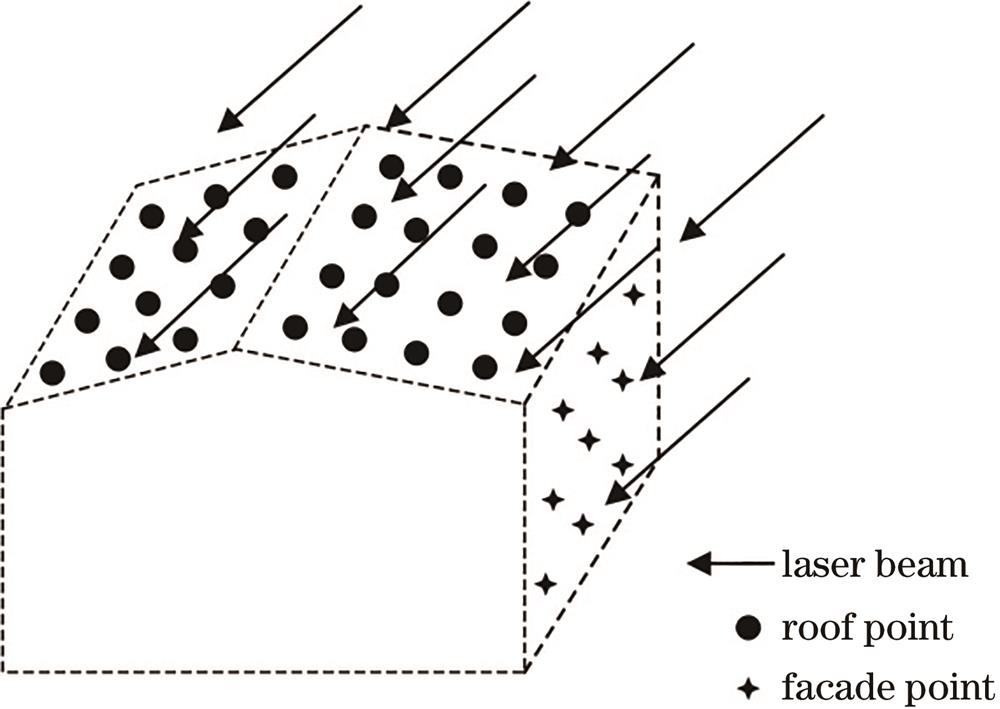
Fig. 2. Diagram of the LiDAR scanning
Fig. 3. Initial contour points extracted by Alpha-shapes algorithm. (a) Roof point cloud; (b) initial contour points
Fig. 4. Steps of the D-P algorithm. (a) End points of the contour line are connected; (b) identification of the key contour point 5; (c) identification of the key contour point 3; (d) extraction result of the key contour point
Fig. 5. Key contour of the building obtained by D-P algorithm
Fig. 6. Correction results of key contour points. (a) Case 1; (b) case 2
Fig. 7. Selection of key contour points
Fig. 8. Final extraction result of the building profile
Fig. 9. Building profile extracted by our algorithm. (a) Sample 1; (b) sample 2; (c) sample 3
Fig. 10. Building profiles extracted by different algorithms. (a) Alpha-shapes algorithm; (b) our algorithm
Fig. 11. Schematic diagram of the area in precision evaluation index
Fig. 12. Accuracy of different algorithms for sample 1
Fig. 13. Accuracy of different algorithms for sample 2
Fig. 14. Accuracy of different algorithms for sample 3
Fig. 15. Average value of the evaluation indicators of the three groups of samples
|
Table 1. Experimental data information

Set citation alerts for the article
Please enter your email address
© Copyright 2018-2021 | Chinese Laser Press. All Rights Reserved 沪ICP备15018463号-20