• Laser & Optoelectronics Progress
  • Vol. 58, Issue 19, 1906006 (2021)
Baiyan Hu1, Furong Wen1, Yongshan Cheng1, Weidong Wu1, and Quan Qi2、*
Author Affiliations
  • 1School of Computer and Information, Hubei Normal University, Huangshi , Hubei 435002, China
  • 2Information Department, General Hospital of the Central Theater Command of the People's Liberation Army, Wuhan , Hubei 430014, China
  • show less
    DOI: 10.3788/LOP202158.1906006 Cite this Article Set citation alerts
    Baiyan Hu, Furong Wen, Yongshan Cheng, Weidong Wu, Quan Qi. Simultaneous Measurement of Temperature and Pressure Based on Cascaded Fabry-Perot Interferometer[J]. Laser & Optoelectronics Progress, 2021, 58(19): 1906006 Copy Citation Text show less
    Schematic diagrams of sensor structure. (a) Schematic diagram of sensing structure; (b) sample 1; (c) sample 2
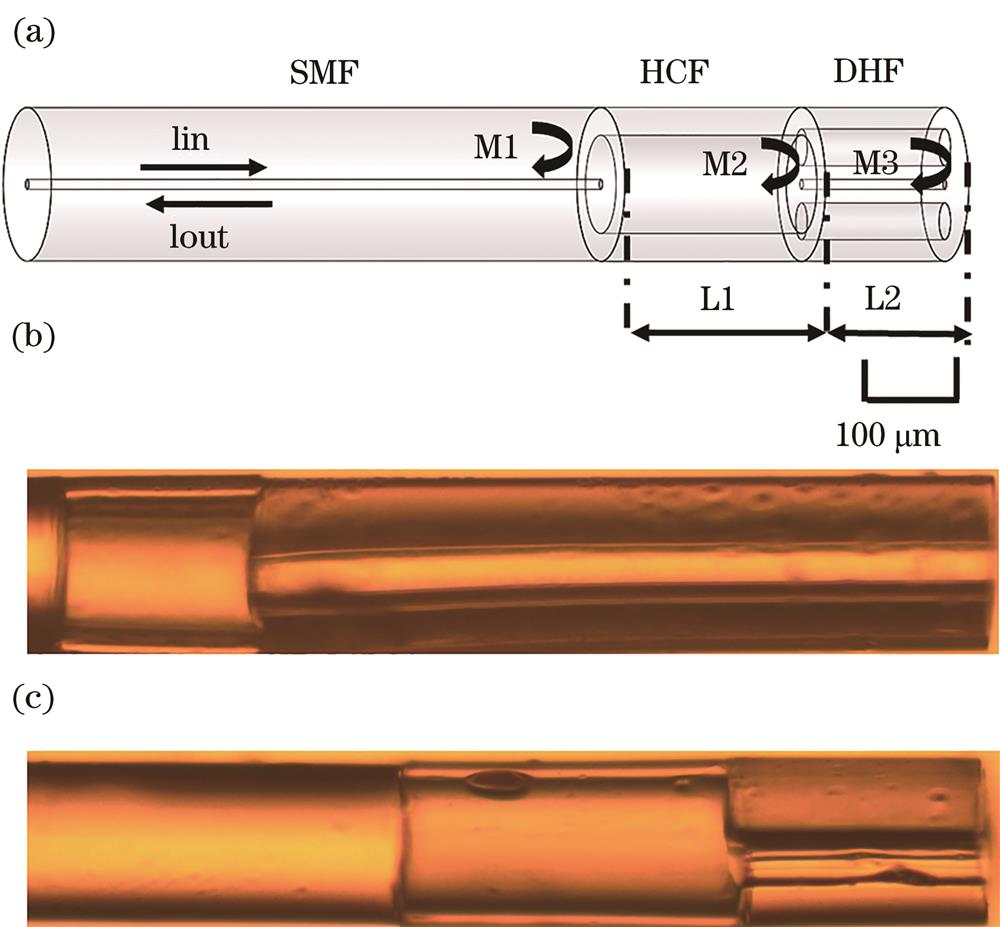
    Fig. 1. Schematic diagrams of sensor structure. (a) Schematic diagram of sensing structure; (b) sample 1; (c) sample 2
    Interference spectra. (a) Original spectrum at room temperature; (b) FFT frequency spectrum; spectra of (c) air cavity FPI and (d) mixed cavity FPI
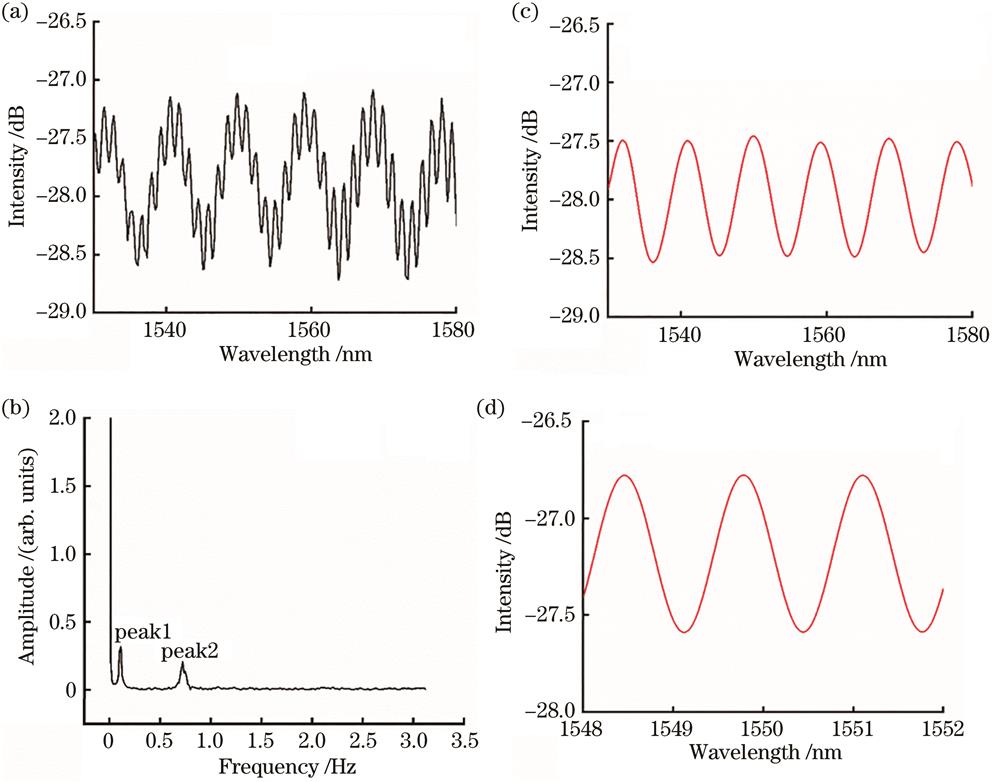
    Fig. 2. Interference spectra. (a) Original spectrum at room temperature; (b) FFT frequency spectrum; spectra of (c) air cavity FPI and (d) mixed cavity FPI
    Test experimental setup
    Fig. 3. Test experimental setup
    Fitting curves of air pressure sensitivity of air-cavity FPI for samples. (a) Sample 1; (b) sample 2
    Fig. 4. Fitting curves of air pressure sensitivity of air-cavity FPI for samples. (a) Sample 1; (b) sample 2
    Fitting curves of air pressure sensitivity of mixed cavity FPI for samples. (a) Sample 1; (b) sample 2
    Fig. 5. Fitting curves of air pressure sensitivity of mixed cavity FPI for samples. (a) Sample 1; (b) sample 2
    Temperature sensitivity curves of air pressure FPI of samples. (a) Sample 1; (b) sample 2
    Fig. 6. Temperature sensitivity curves of air pressure FPI of samples. (a) Sample 1; (b) sample 2
    Temperature sensitivity curves of mixed cavity FPI of samples. (a) Sample 1; (b) sample 2
    Fig. 7. Temperature sensitivity curves of mixed cavity FPI of samples. (a) Sample 1; (b) sample 2
    SampleLength of HCF L1 /μmLength of DHF L2 /μmL1 /L2
    Sample 11495980.25
    Sample 22141691.27
    Table 1. Optical fiber structure parameters of cascaded FPI
    Baiyan Hu, Furong Wen, Yongshan Cheng, Weidong Wu, Quan Qi. Simultaneous Measurement of Temperature and Pressure Based on Cascaded Fabry-Perot Interferometer[J]. Laser & Optoelectronics Progress, 2021, 58(19): 1906006
    Download Citation