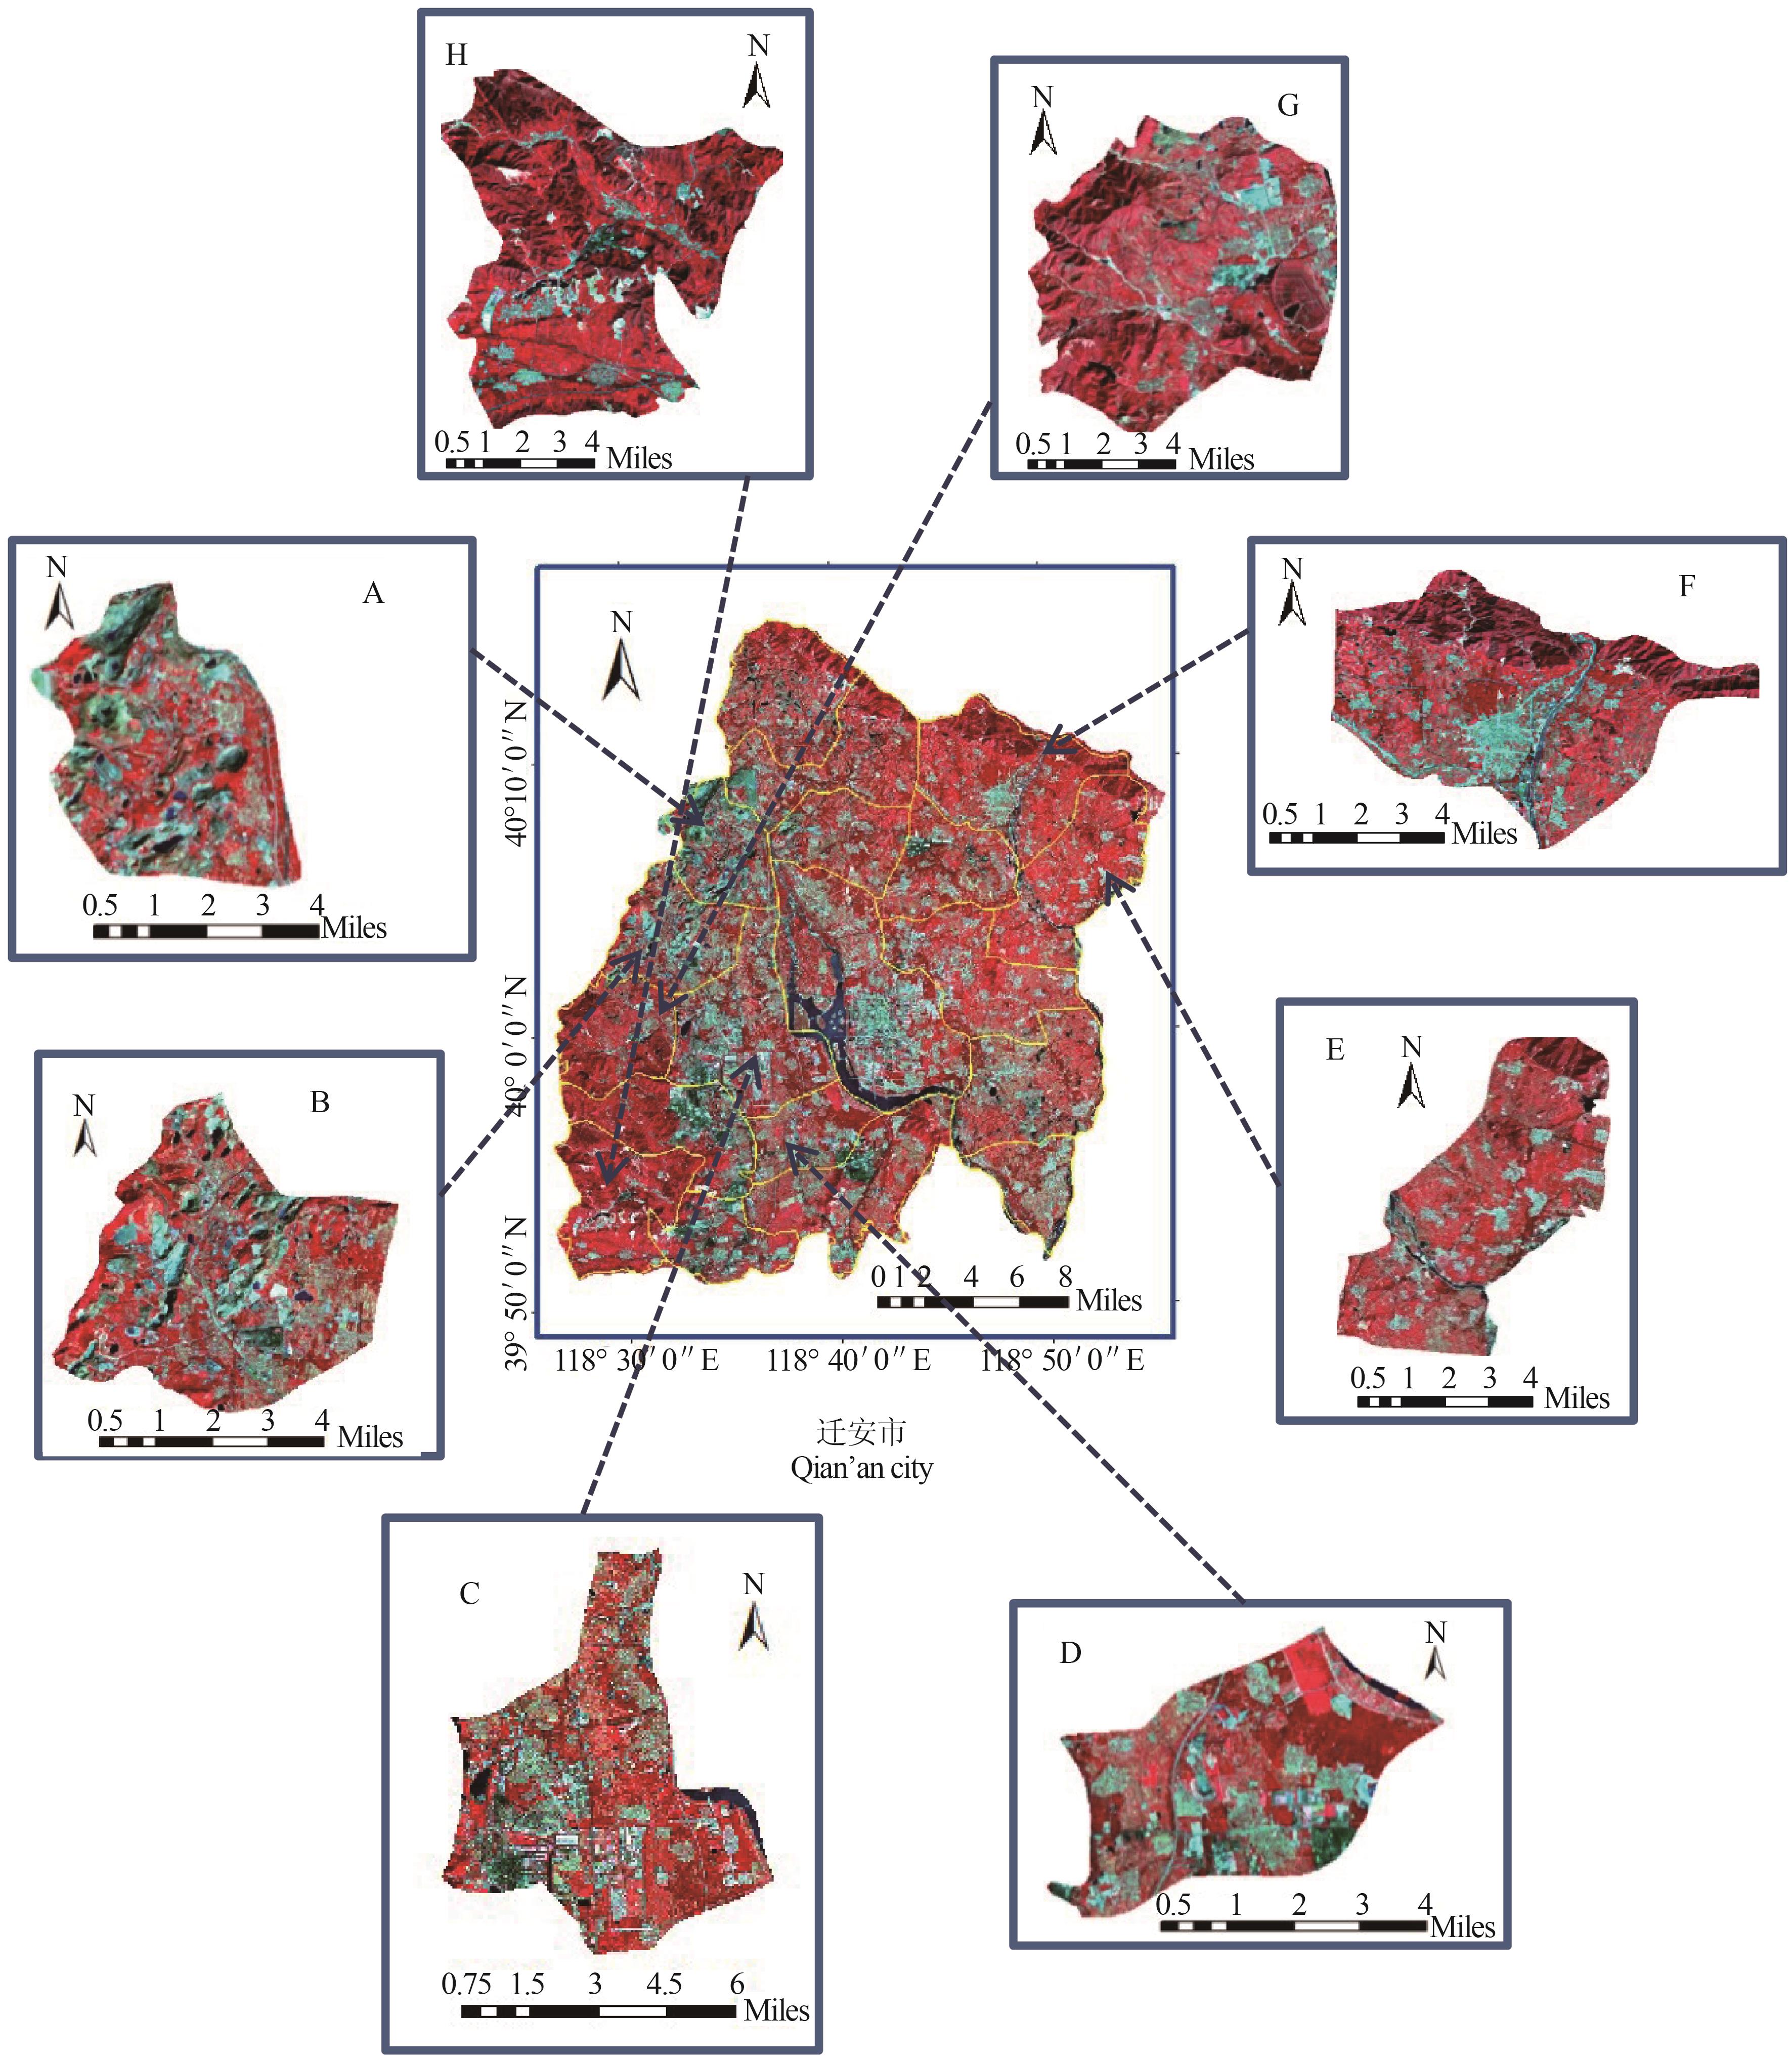
Fig. 1. Landsat satellite image of study area
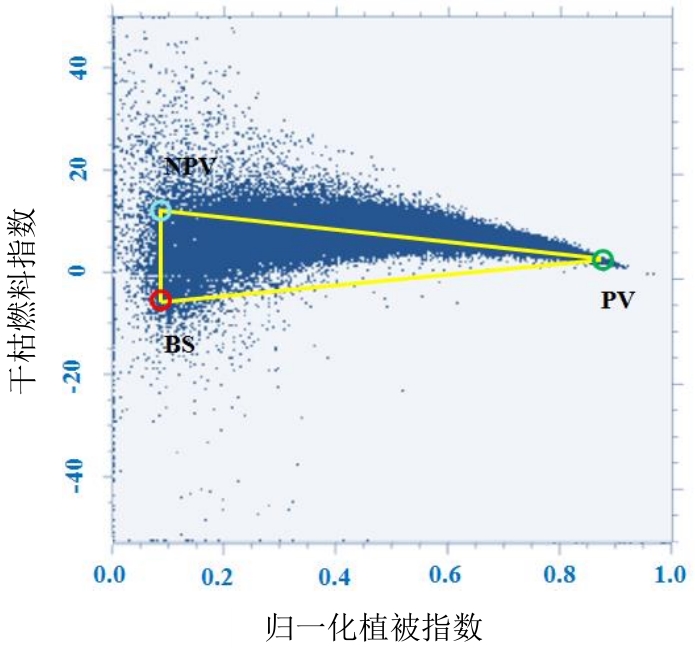
Fig. 2. Feature space of NDVI-DFI in 2000
Fig. 3. RSIEI flow chart of calculation
Fig. 4. Comparison on RTE of Landsat data and MODIS temperature product
Fig. 5. Land use classification of Qian’an City of 2018
Fig. 6. Percentage of land occupied by various types of ground objects in 8 townships on 2018
Fig. 7. Spatial distribution of LST in study area from 2000 to 2018
Fig. 8. Spatial distribution patterns of LST and RSIEI in the study area on 2018
Fig. 9. Spatial distribution patterns of LST and RSIEI in the A town on 2018.
Fig. 10. Spatial distribution of RSIEI in study area from 2000 to 2018
Fig. 11. RSIEI values of four areas of mining intensive development from 2000 to 2018
Fig. 12. Single factor regression results based on RSIEI(x) and normalized LST(y) of 2018
Fig. 13. Comparison of normalized RSIEI and normalized LST between four mining intensive towns and four non mining intensive towns in 2018
| 卫星 | 传感器类型 | 影像过境日期 | 影像过境时间 | 云量/% | 轨道号 | 波段数/个 |
|---|
| Landsat 5 | TM | 2000-9-6 | AM 10:25 | 0.01% | 122/32 | 7 | | Landsat 5 | TM | 2008-9-12 | AM 10:32 | 0.01% | 122/32 | 7 | | Landsat 8 | OLI/TIRS | 2018-9-8 | AM 10:46 | 1.98% | 122/32 | 9/2 |
|
Table 1. 遥感影像数据
| 大气校正参数 | 2000-9-6 | 2008-9-12 | 2018-9-8 |
|---|
| 热红外波段大气透过率τ | 0.92 | 0.80 | 0.83 | | 大气向上辐射亮度Lu | 0.55 | 1.51 | 1.27 | | 大气向下辐射亮度Ld | 0.96 | 2.51 | 2.14 |
|
Table 2. 大气校正参数
| 年份 | 区域 | 林地 | 耕地 | 工矿用地 | 居民地 | 水域 |
|---|
| 2000年 | A | 17.53 | 22.53 | 31.38 | 27.62 | 16.78 | | B | 18.62 | 22.23 | 32.26 | 26.56 | 15.25 | | C | 18.44 | 21.07 | 31.59 | 28.11 | 14.97 | | D | 19.03 | 22.01 | 31.21 | 27.74 | 15.36 | | 2008年 | A | 26.20 | 28.11 | 37.52 | 29.80 | 22.53 | | B | 27.78 | 30.47 | 37.88 | 31.12 | 21.58 | | C | 27.10 | 30.97 | 36.87 | 32.19 | 20.22 | | D | 26.94 | 29.68 | 36.99 | 29.87 | 21.87 | | 2018年 | A | 25.25 | 31.77 | 36.78 | 33.54 | 22.61 | | B | 26.32 | 32.01 | 37.21 | 33.33 | 22.02 | | C | 25.88 | 32.58 | 36.82 | 34.25 | 21.32 | | D | 25.78 | 30.15 | 36.32 | 32.89 | 20.20 |
|
Table 3. 2000~2018年矿业开发密集区各地物LST均值(°C)
| Town | fPV - LST | NDMI - LST | NDBI - LST | BSI - LST |
|---|
| A | y = -7.54x + 35.09 R2 = 0.45 | y = -8.43x + 35.39 R2 = 0.59 | y = 8.25x + 26.88 R2 = 0.55 | y = 8.45x + 26.71 R2 = 0.63 | | B | y = -9.02x + 35.31 R2 = 0.61 | y = -10.14x + 35.32 R2 = 0.75 | y = 10.00x + 25.05 R2= 0.74 | y = 8.63x + 25.58 R2 = 0.76 | | C | y = -7.63x + 35.00 R2 = 0.46 | y = -8.22x + 34.79 R2 = 0.64 | y = 8.48x + 26.36 R2 = 0.59 | y = 7.83x + 26.62 R2 = 0.61 | | D | y = -8.42x + 34.70 R2 = 0.69 | y = -9.17x + 34.98 R2 = 0.81 | y = 9.16x + 25.64 R2 = 0.81 | y = 8.28x + 25.91 R2 = 0.82 |
|
Table 4. 2018年矿业开发密集区4个生态参数与LST回归分析
年份 Year | 指标 Indicator | 第1主成分 PCA1 | 第2主成分 PCA2 | 第3主成分 PCA3 | 第4主成分 PCA4 |
|---|
| 2000 | 特征值贡献率 Percent of Eigenvalue(%) | 96.49 | 3.20 | 0.31 | 0.00 | | 2008 | 特征值贡献率 Percent of Eigenvalue(%) | 92.50 | 7.04 | 0.47 | 0.00 | | 2018 | 特征值贡献率 Percent of Eigenvalue(%) | 92.50 | 6.36 | 1.13 | 0.00 |
|
Table 5. 2000~2018年4个陆表生物物理指标主成分分析
| 年份 | 区域 | fPV | NDMI | NDBI | BSI |
|---|
| 2000 | A | -0.4800 | -0.5079 | 0.5042 | 0.5074 | | B | -0.4392 | -0.5115 | 0.5107 | 0.5336 | | C | -0.4358 | -0.5072 | 0.5091 | 0.5418 | | D | -0.4072 | -0.5102 | 0.5132 | 0.5572 | | 2008 | A | -0.4651 | -0.5157 | 0.5138 | 0.5038 | | B | -0.4440 | -0.5122 | 0.5106 | 0.5290 | | C | -0.3756 | -0.5318 | 0.5314 | 0.5420 | | D | -0.3183 | -0.5462 | 0.5465 | 0.5492 | | 2018 | A | -0.4963 | -0.5061 | 0.5015 | 0.4961 | | B | -0.4624 | -0.5112 | 0.5079 | 0.5166 | | C | -0.4430 | -0.5191 | 0.5182 | 0.5155 | | D | -0.4448 | -0.5077 | 0.5074 | 0.5356 |
|
Table 6. 2000~2018年4个陆表生物物理指标PCA1载荷统计值
| 等级 | RSIEI | 区域 | 面积占比% | 变化幅度 |
|---|
| 2000 | 2008 | 2018 | 2000—2008 | 2008—2018 | 2000—2018 |
|---|
| 差 | 0~0.2 | A | 18.86 | 17.08 | 20.30 | -1.78 | 2.5 | 1.44 | | B | 5.93 | 20.75 | 13.31 | 7.91 | -7.44 | 7.38 | | C | 3.36 | 6.46 | 5.19 | 3.1 | -1.27 | 1.83 | | D | 1.33 | 3.05 | 3.63 | 1.72 | 0.59 | 2.30 | | 较差 | 0.2~0.4 | A | 9.41 | 18.64 | 15.55 | 9.23 | -3.09 | 6.14 | | B | 4.32 | 23.56 | 12.56 | 8.25 | -11 | 8.24 | | C | 5.04 | 13.58 | 12.40 | 8.54 | -1.18 | 7.36 | | D | 2.35 | 10.18 | 10.12 | 7.83 | -0.06 | 7.77 | | 中等 | 0.4~0.6 | A | 8.91 | 16.89 | 14.71 | 7.98 | -2.18 | 5.8 | | B | 5.75 | 12.29 | 14.41 | 7.84 | 2.12 | 8.66 | | C | 6.80 | 18.91 | 15.71 | 12.11 | -3.2 | 8.91 | | D | 4.53 | 18.17 | 14.01 | 13.64 | -4.16 | 9.48 | | 良好 | 0.6~0.8 | A | 8.48 | 13.51 | 12.70 | 5.03 | -0.81 | 4.22 | | B | 6.81 | 1.98 | 14.43 | 6.82 | 12.45 | 7.62 | | C | 6.10 | 19.64 | 15.16 | 13.54 | -4.48 | 9.06 | | D | 5.25 | 22.86 | 15.95 | 17.61 | -6.92 | 10.70 | | 优秀 | 0.8~1 | A | 54.34 | 33.88 | 36.74 | -20.46 | 2.86 | -17.6 | | B | 77.19 | 41.43 | 45.2 9 | -30.82 | 3.86 | -31.9 | | C | 78.70 | 41.41 | 51.54 | -37.29 | 10.13 | -27.16 | | D | 86.54 | 45.74 | 56.29 | -40.8 | 10.55 | -30.25 |
|
Table 7. 2000~2018年RSIEI等级变化