
Yuehua Li, Peng Liu, Jingbo Zhou, Youzhi Ren, Jiangyan Jin. Center Extraction of Structured Light Stripe Based on Back Propagation Neural Network[J]. Acta Optica Sinica, 2019, 39(12): 1212005
- Acta Optica Sinica
- Vol. 39, Issue 12, 1212005 (2019)
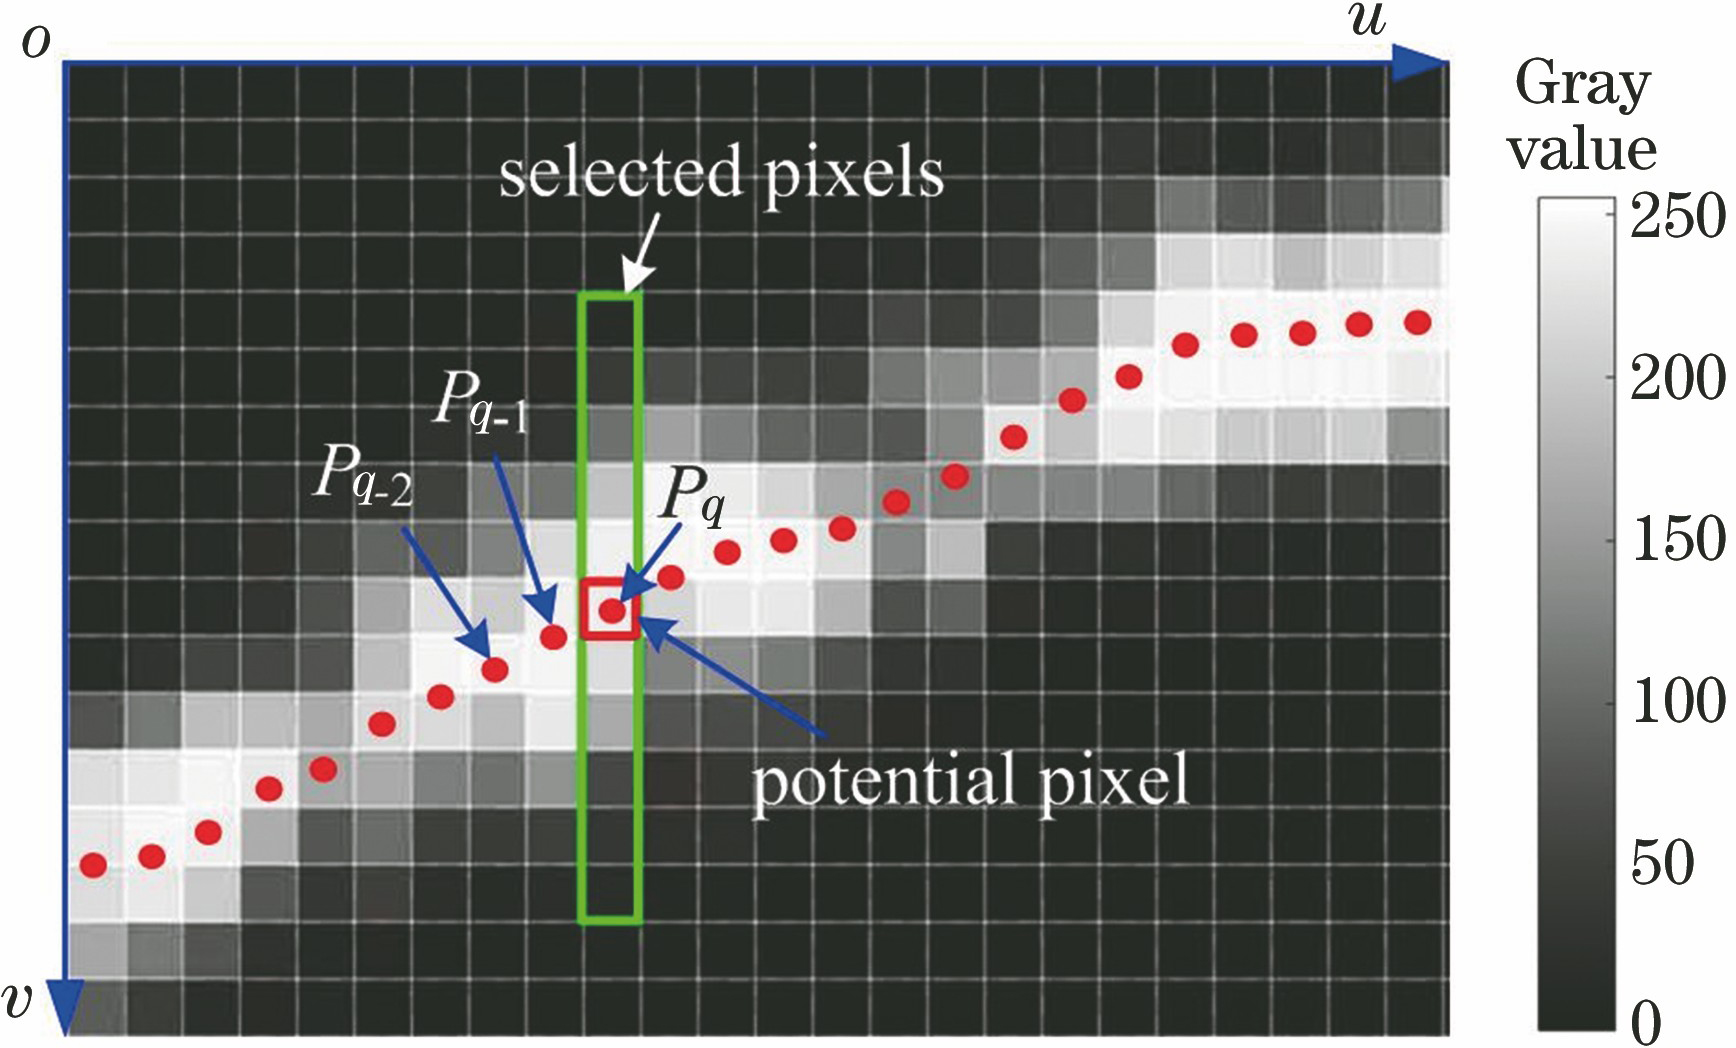
Fig. 1. Selection of pixels of cross section profile

Fig. 2. Basic principle of center computation of each column using neural network
Fig. 3. Light stripes with different shapes for network training. (a) Falling stripe; (d) rising stripe; (c) horizontal stripe; (d) random stripe
Fig. 4. Convergence curve of root mean square error
Fig. 5. Gray value of stripe cross
Fig. 6. Histogram of center extraction error
Fig. 7. Center extraction results of strips with different shapes. (a) Arc stripe; (b) random stripe; (c) discontinuous stripe; (d) tooth stripe
Fig. 8. Sample of straight line
Fig. 9. Center extraction error of linear stipe for different numbers of hidden layer neurons. (a) Average value; (b) root mean square value
Fig. 10. Center extraction result of stripe and error comparison. (a) Center extraction result of stripe using neural network; (b) comparison of center extraction errors
Fig. 11. Comparison of center extraction results for different stripe qualities. (a) Original stripe; (b) under exposed stripe; (c) normal exposed stripe; (d) over exposed stripe
|
Table 1. Mean square error and error distribution 3σ value under different noises
| |||||||||||||||||||||||
Table 2. Center extraction error for different numbers of hidden layers
|
Table 3. Stripe center extraction error from network using different training samples
| |||||||||||||||||||||||||||
Table 4. Erms obtained by different center extraction methods for different angles between stripe and horizontal direction
| |||||||||||
Table 5. Run time of different center extraction methods

Set citation alerts for the article
Please enter your email address
© Copyright 2018-2021 | Chinese Laser Press. All Rights Reserved 沪ICP备15018463号-20