• Laser & Optoelectronics Progress
  • Vol. 58, Issue 17, 1714009 (2021)
Cheng Chen1、*, Xijun Hua1, Dongpo Zhu1, sheng Xu2, and xuan Xie2
Author Affiliations
  • 1School of Mechanical Engineering, Jiangsu University, Zhenjiang , Jiangsu 212013, China
  • 2School of Automotive and Transportation Engineering, Jiangsu University, Zhenjiang , Jiangsu 212013, China
  • show less
    DOI: 10.3788/LOP202158.1714009 Cite this Article Set citation alerts
    Cheng Chen, Xijun Hua, Dongpo Zhu, sheng Xu, xuan Xie. Effect of Pulse Times on Texture Morphology under Millisecond Laser[J]. Laser & Optoelectronics Progress, 2021, 58(17): 1714009 Copy Citation Text show less
    Meshing diagram
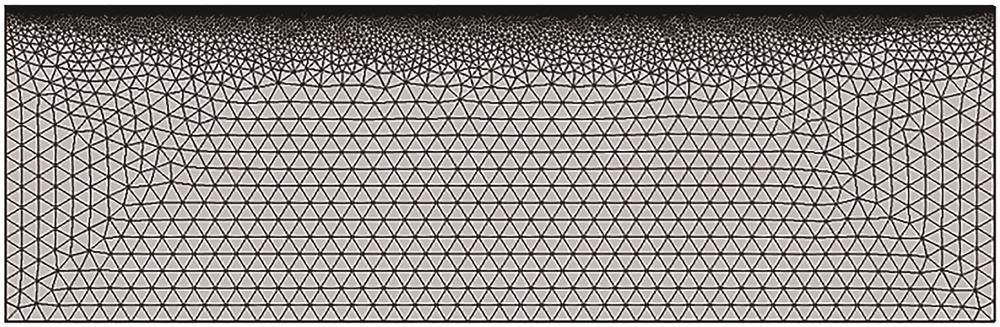
    Fig. 1. Meshing diagram
    Morphologies of different pulses. (a) 5 times; (b) 10 times; (c) 20 times
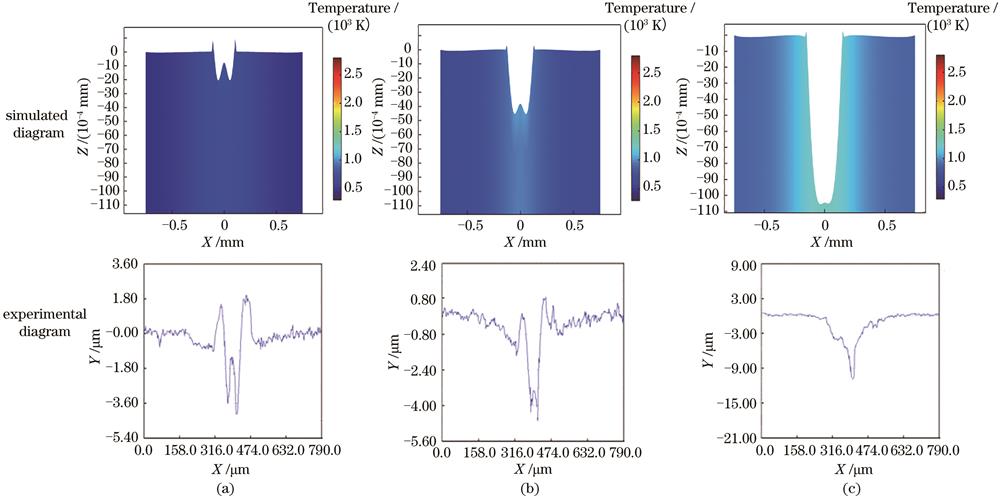
    Fig. 2. Morphologies of different pulses. (a) 5 times; (b) 10 times; (c) 20 times
    Distribution map of melt flow under different heating time. (a) t=0.40 ms; (b) t=0.60 ms; (c) t=0.95 ms
    Fig. 3. Distribution map of melt flow under different heating time. (a) t=0.40 ms; (b) t=0.60 ms; (c) t=0.95 ms
    Stress curves under different heating time. (a) t=0.40 ms; (b) t=0.60 ms; (c) t=0.95 ms
    Fig. 4. Stress curves under different heating time. (a) t=0.40 ms; (b) t=0.60 ms; (c) t=0.95 ms
    Distribution map of melt flow under different cooling time. (a) t=1.015 ms; (b) t=1.120 ms
    Fig. 5. Distribution map of melt flow under different cooling time. (a) t=1.015 ms; (b) t=1.120 ms
    Stress curves at different cooling time. (a) t=1.015 ms; (b) t=1.120 ms
    Fig. 6. Stress curves at different cooling time. (a) t=1.015 ms; (b) t=1.120 ms
    Stress curves at different time. (a) t=201 ms; (b) t=401 ms
    Fig. 7. Stress curves at different time. (a) t=201 ms; (b) t=401 ms
    Cheng Chen, Xijun Hua, Dongpo Zhu, sheng Xu, xuan Xie. Effect of Pulse Times on Texture Morphology under Millisecond Laser[J]. Laser & Optoelectronics Progress, 2021, 58(17): 1714009
    Download Citation