Key Laboratory for Ultrafine Materials of Ministry of Education, School of Materials Science and Engineering, East China University of Science and Technology, Shanghai 200237, China
Zinc strontium phosphate glasses doped with different trivalent praseodymium ion () concentrations are presented and their photoluminescence properties are investigated upon 442 nm excitation. With the concentration decreasing, the orange emission of () is enhanced steadily at the cost of its blue emission (). Monochromic orange emission of ions is obtained when the doping is reduced to 0.05 mol.%. The mechanism controlling the monochromatic characteristic of emissions is supposed to be associated with the phonon-aided nonradiative relaxation process of :
Rare earth (RE) trivalent praseodymium ion () possesses abundant energy levels showing intensive emissions in ultraviolet (UV), visible, and infrared (IR) regions upon multiwavelength excitations. The characteristic emissions enable ions to act as functional centers in various optical materials for different applications, such as in solid-state lasers, fiber amplifiers, flat panel displays, scintillation detectors, and various phosphors[1–7]. Therefore, photoluminescence (PL) properties of have always been investigated as a focused interest for researchers in a wide range of works[5–10]. We have more recently reported the UV and visible PL properties of in strontium phosphate glasses, and demonstrated that upon 448 nm excitation the relative intensity of the blue emission () to that of the composite orange one () is highly sensitive to the concentration[10]. This phenomenon is closely related to the interaction of ions with lattice phonons of the host; that is, the phonon-aided nonradiative relaxation (NRR) process likely occurs, thus increasing the emission intensity of the transition relative to that of the . In other words, the monochromic orange emission originating from the level of ions could be controlled by increasing the probability of the NRR process. As matter of fact, there have been relevant reports in this respect on glasses containing ions[10–15], but there still have been many interesting phenomena waiting for us to discover. In the present paper, we investigate PL properties of zinc strontium phosphate (ZSP) glasses doped with a relatively low concentration, and discuss the mechanism involved for realizing the monochromatic orange emission. As an optical material, glass is very competitive owing to its lower cost of synthesis, ease of fabrication, and flexibility of applications[16–20]. Therefore, this Letter will be significant for the possibility of enormous value in many fields such as lighting sources and lasers.
In the present work, the ZSP glass was used as the host and sodium zinc tellurite (NZT) and barium gadolinium germinate (BGG) glasses as the reference hosts for doping ions of different concentrations ranging from 0.05 to 1.0 mol.% (Table 1). Glass samples were prepared by the conventional melt-quenching method using analytical-grade reagents of ZnO, , , , and , and (99.95%), (99.999%), (3N), and (99.9%) as initial materials. The batches were well mixed and ground, then melted in aluminum crucibles. The experimental melting conditions for phosphate glasses were same as our previous work[10], while germinate and telluride glass samples were melted at 1550°C for 3 h and 850°C for 2 h, respectively[21,22]. Glass melts were poured onto the preheated steel mould and quenched in air. The prepared glass samples were annealed at a temperature close to for 3 h to remove the inner stress induced during quenching. All of the samples were cut into 2.5 mm-thick square pieces and were well polished to a good optical quality.
Code
G1
G2
G3
G4
G5
G6
G7
Matrices
ZSP
NZT
BGG
Phonon Energy (cm−1)
1400
700
1100
Pr3+ (mol.%)
1.0
0.5
0.2
0.1
0.05
0.05
0.05
Table 1. Pr3+ Doping Concentrations of Glass Samples
The UV and visible absorption spectra of the samples were obtained by a Unico UV-2102 PC spectrophotometer. PL spectra and decay curves were recorded by a Fluorolog-3-P UV-vis-NIR fluorescence spectrophotometer (Jobin Yvon, Longjumeau, French). All measurements were carried out at room temperature.
Sign up for Chinese Optics Letters TOC. Get the latest issue of Chinese Optics Letters delivered right to you!Sign up now
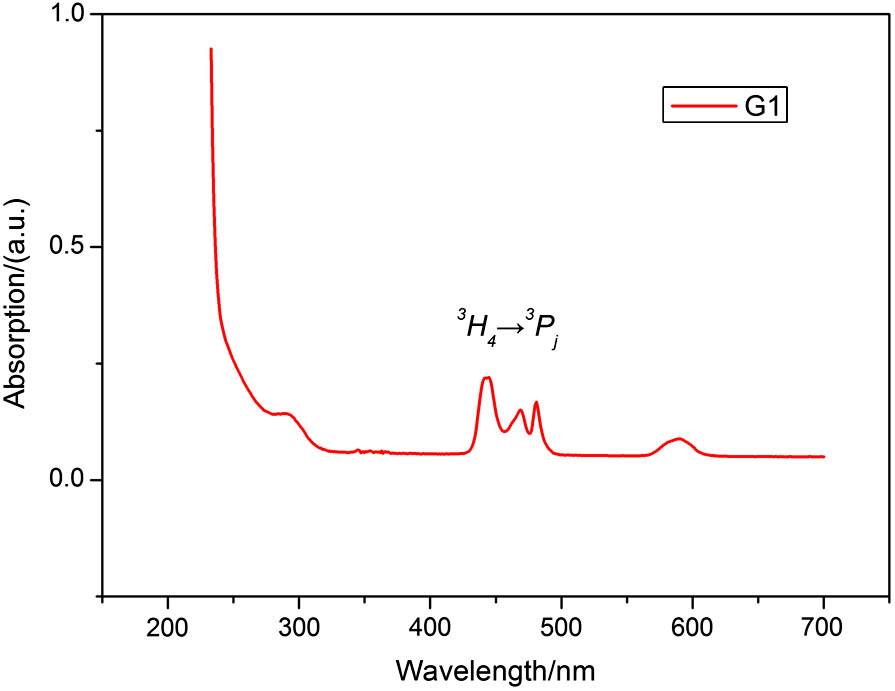
Figure 1 presents the absorption spectrum of the ZSP (G1) sample (containing 1.0 mol% ). The ZSP glass shows a good transparency from the visible to the deep UV region with a cutoff edge close to 210 nm, similar to the strontium phosphate glass, as reported[10]. Four obvious absorption bands are distinguished in the visible region located at 442, 466, 480, and 590 nm, which are associated with the transitions of ions: () and , respectively. Moreover, a weak UV absorption band around 290 nm is detectable, which should be assigned to the interconfiguration of the transition of ions (), according to previous work[10].
Figure 1.Absorption spectrum of G1 sample (1.0 mol% ).
Emission spectra of ZSP glasses with different concentrations are shown in Fig. 2(a). Upon 442 nm excitation, emission bands due to the transitions of ions between (481, 488 nm), (522 nm), (597, 610 nm), and (640 nm) levels are observed, which are identical to the previously published work[10]. Much impressively, with the decrease in concentration, all emissions originating from the levels are weakened greatly while that from the level enhanced steadily. Taking the intensity ratio of orange/blue (599/482 nm) emissions as an example, it increases monotonously from 1.67 (G1) to 23.16 (G5), as shown in Fig. 2(b), indicating that the energy transfer from to dominates in the 442 nm excitation process on glasses with the lower concentration, leading to a monochromatic orange emission [inset of Fig. 2(b)]. The concentration dependence of the monochromatic orange emission is also evidenced by excitation spectra compared between samples G1 (1.0 mol% ) and G5 (0.05 mol% ). As seen in Fig. 2(c), three excitation bands at 442, 466, and 480 nm are observed and they are assigned to transitions corresponding to the absorption spectrum in Fig. 1. It is seen that excitation bands obtained by monitoring emissions at both 599 and 482 nm have a similar shape and location for both samples, however, their energy distribution is quite different. G5 shows much more intense excitation bands when monitoring at 599 nm than at 482 nm, while G1 does not show a similar evolution.
Figure 2.(a) Emission spectra of ZSP samples, (b) ratio of 599/482 intensity as a function of the concentration and (c) excitation spectra of G5 and G1 monitored at 599 or 482 nm.
Further supporting evidences come from their decay curves (, ), which are compared in Fig. 3. The curves can be well fitted by a second-order exponential decay model using the equation[23]where is the luminescence intensity, and are constants, is the time, and and are the rapid and slow parts of the lifetime. To calculate the average lifetime (), we useThe calculated of the G1 and G5 samples are 14.61 and 15.27 μs, respectively. The prolonged decay time of G5 with the decreased doping concentration demonstrates the enlarged population of electrons at the level, which is in accordance with the supposed ET process of .
As illustrated in the simplified energy level diagram of ions in Fig. 4, the orange emission () under the 442 nm excitation depends on the phonon-aided NRR process resulting from the interaction between ions and the glass matrix. For the same host, the lower concentration may increase the probability of the NRR process due to less interaction between the ions themselves. Therefore, the G4 and G5 samples show around a 90% quenched blue emission that initiates from the upper level and a greatly enhanced orange emission from the lower level. In this regard, it is easy to infer that at the lower level of concentration, the phonon energy of the host becomes another factor influencing the NRR process[24,25]. The phosphate glass possesses the higher phonon energy (Table 1); thus, it is reasonable to attribute the monochromatic orange emissions of the present -doped ZSP glasses to the higher probability of the NRR process due to the joint effects of the lower concentration and the higher phonon energy of the host.
To clarify the above explanations, NZT and BGG glasses were taken as the reference hosts (G6, G7) for doping the same concentration as G5 (0.05 mol.%) and compared in Fig. 5 with G5 for their emission spectra on excitation at 442 nm. Different from G5, G6 and G7 show multiple emission bands where the blue emission is more intense than the orange one. Further comparison between G6 and G7 exhibits the much lower orange/blue intensity ratio of G6 (1.33) than that of G7 (2.10), as well as the sharp emission at 640 nm (G6) compared with the weak one (G7), corresponding well to the lower phonon energy of G6 than that of G7. Such differences agree with our expectations and demonstrate the lower probability of the : NRR process in G6 and G7 than in G5, consequently making populated electrons from the excited state to the level insufficient, resulting in the weaker orange emission.
Figure 5.Emission spectra of glass samples with different phonon energy upon 442 nm excitation.
The monochromic orange emission is observed in the ZSP glass doped with the low concentration (0.05 mol.%). Excitation spectra indicate the impact of the concentration on the distribution of the excitation energy while the prolonged decay time of the sample with the decreased doping concentration demonstrates the enlarged population of electrons at the level most likely due to the ET process from . NZT and BGG glasses with the lower phonon energy are taken as reference hosts for comparison, which suggests that the higher phonon energy of the host and the lower concentration of doping favor the monochromic emission from due to the beneficial phonon-aided NRR process.
References
[1] X. Li, X. Liu, L. Zhang, L. Hu, J. Zhang. Chin. Opt. Lett., 11, 121601(2013).