- Spectroscopy and Spectral Analysis
- Vol. 42, Issue 1, 141 (2022)
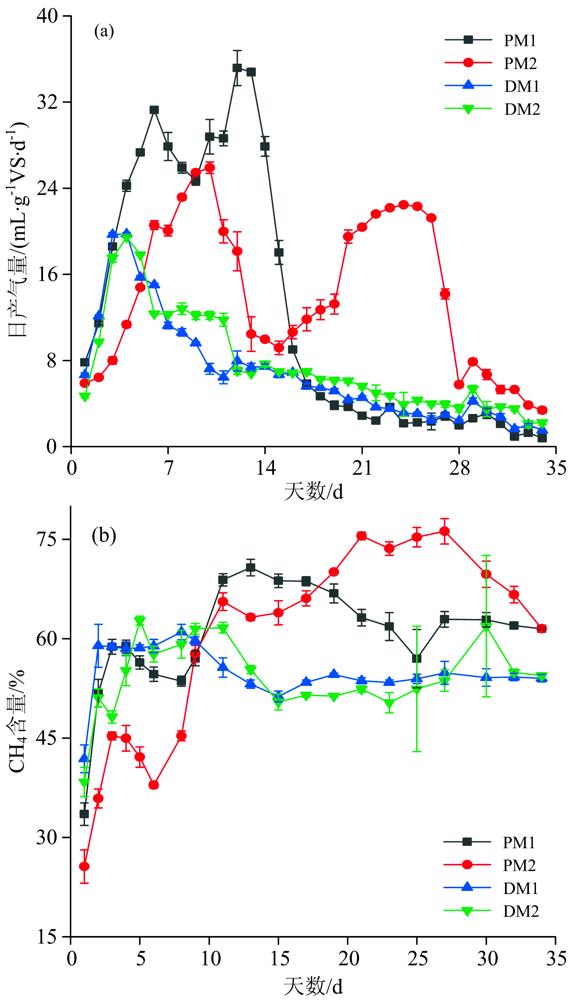
Fig. 1. Changes of gas productivity (a) and methane concentration (b) during the anaerobic digestion of pig and dairy manure slurries
Note: mean±standard errors (n =3)
Note: mean±standard errors (
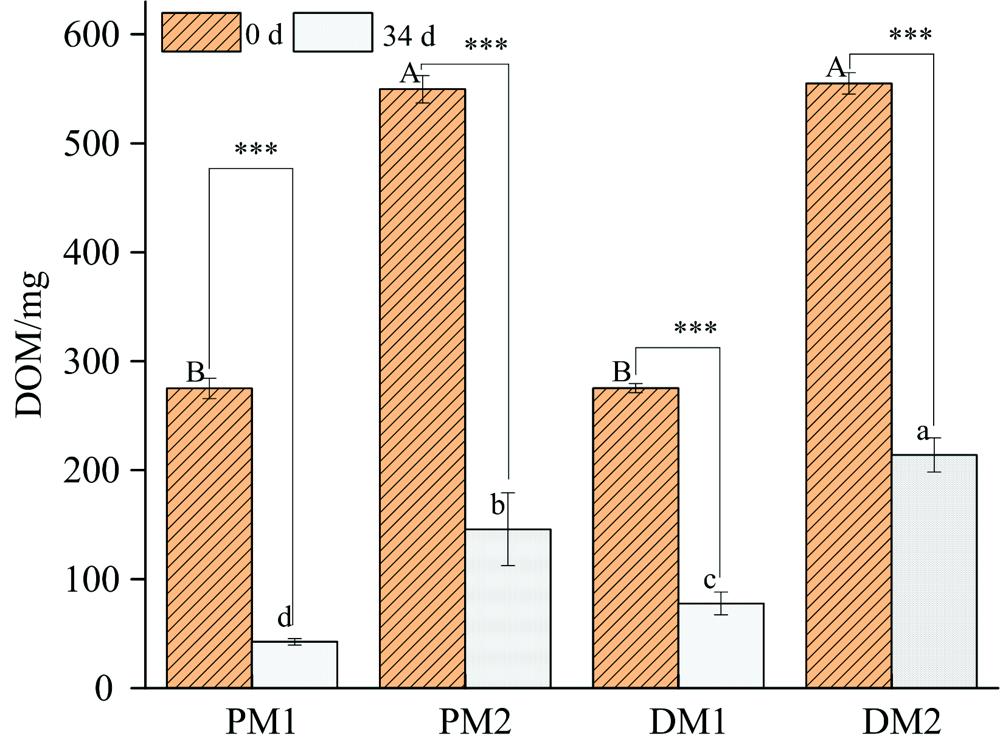
Fig. 2. Changes of DOM content in the raw and digested pig and dairy manure slurries
Note: Different capital and small letters indicate the significant (p <0.05) differences between the treatments in raw and digested materials, respectively; *** indicate significant (p <0.001) differences between the raw and digested materials. The same below.
Note: Different capital and small letters indicate the significant (
Fig. 3. 3DEEM changes of DOM in the raw and digested pig of (a) PM1; (b) PM2; (c) DM1; (d): DM2
Fig. 4. PARAFAC fluorescence components (a) and F max (b) of DOM in the raw and digested pig and dairy manure slurries
Fig. 5. Changes of DOM humification index in the raw and digested pig and dairy manure slurries
Note: ** and *** indicate significant (p <0.01, p <0.001) differences between the raw and digested pig and dairy manure slurries, respectively
Note: ** and *** indicate significant (
|
Table 1. Basic characteristics of the raw materials
| |||||||||||||||||||||||||||||||||
Table 2. The raw material ratios in the experimental treatments
|
Table 3. Fluorescence peak division and attribution of EEM in the raw and digested manure slurries

Download Citation

Set citation alerts for the article
Please enter your email address
© Copyright 2018-2021 | Chinese Laser Press. All Rights Reserved 沪ICP备15018463号-20