
Die Qin, Yongqian Wu, Yan Xu, Shuai Zhang, Ting Deng. Large Angle Positioning Error Correction for Sub-Aperture Stitching Interferometry of Cylindrical X-Ray Mirrors[J]. Laser & Optoelectronics Progress, 2022, 59(17): 1734002
- Laser & Optoelectronics Progress
- Vol. 59, Issue 17, 1734002 (2022)
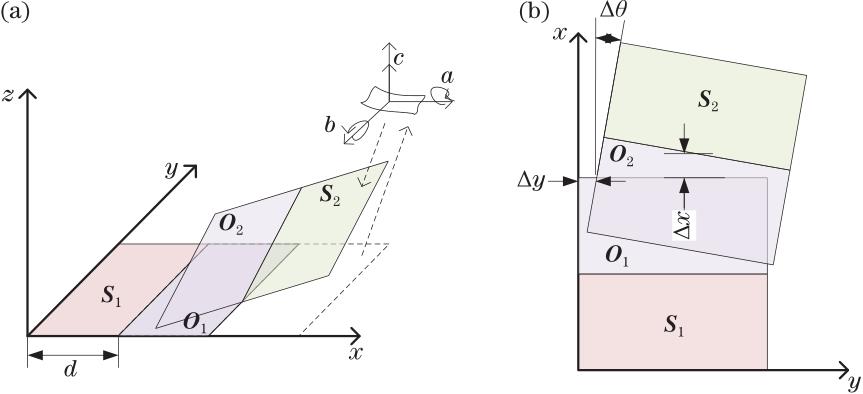
Fig. 1. Schematic diagram of sub-aperture stitching. (a) Stitching of adjacent sub-apertures; (b) sub-aperture mechanical positioning error
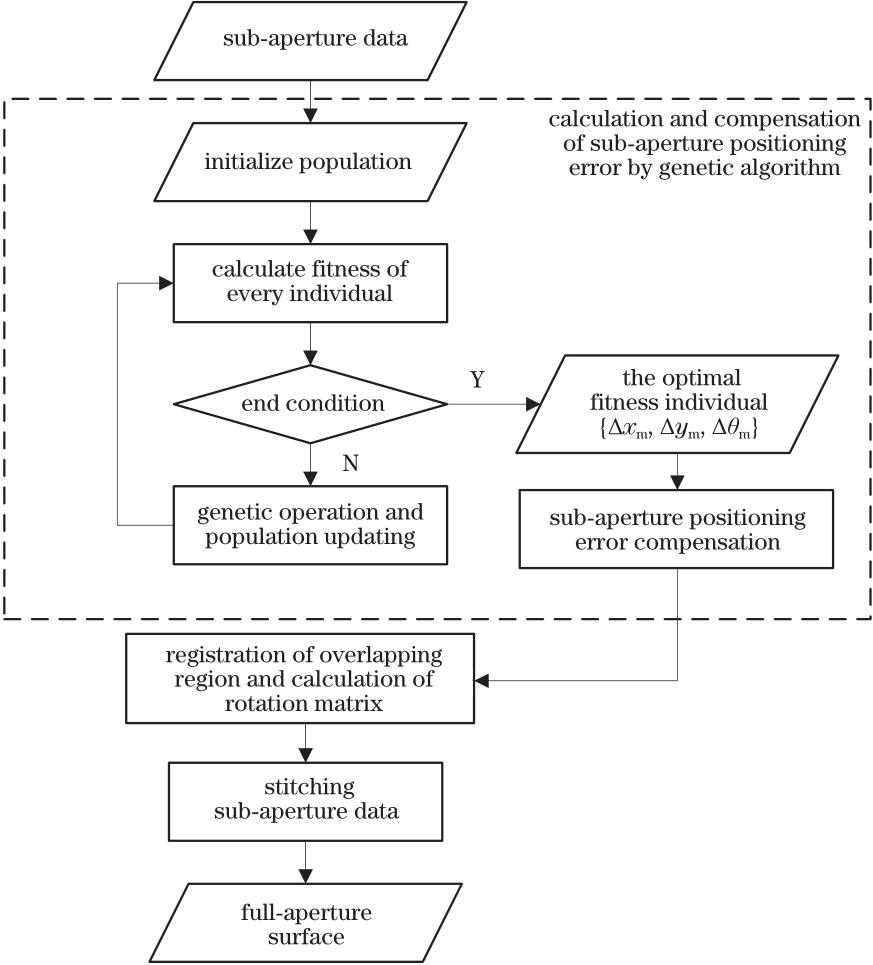
Fig. 2. Flow chart of the algorithm
Fig. 3. Simulated cylindrical mirror and sub-apertures. (a) Fitting surface of cylindrical mirror; (b) simulated sub-apertures
Fig. 4. Sub-aperture compensation effect. (a)-(d) Residuals between sub-aperture surface and original fitting sub-aperture surface when adding -5°, -2°, 2°, 5° angle errors; (e)-(h) residuals between original fitting sub-aperture surface and sub-aperture surface after angle error compensation
Fig. 5. Simulation of stitching compensation. (a) Original simulation surface; (b) stitching surface after introducing positioning error; (c) stitching surface after positioning error compensation; (d) residuals between original simulation surface and stitching surface after introducing positioning error; (e) residuals between original simulation surface and stitching surface after positioning error compensation
Fig. 6. Measuring device and tested mirror. (a) 6 inch interferometer; (b) elliptic cylindrical mirror
Fig. 7. Effect of single sub-aperture compensation. (a) Original sub-aperture
Fig. 8. Effect of full-aperture stitching compensation. (a) Original sub-aperture stitching surface
Fig. 9. Stitching surface and long trace profiler measurement results. (a) Stitching surface before positioning error compensation; (b) stitching surface after positioning error compensation; (c) center line measured by long trace profiler; (d) residuals between long trace profiler surface and stitching surface before error compensation; (e) residuals between long trace profiler surface and stitching surface after error compensation
|
Table 1. Key parameters of genetic algorithm
|
Table 2. Simulated cylindrical mirror parameters
| |||||||||||||||||||||||||||||||||||||||||||||||||||||||||||||||||||||||||||||||||||||||||||||||||||||||||||||||||||||||||||||||||||||||||||||||||||||
Table 3. Addition of positioning error and algorithm estimation results
|
Table 4. Position error addition of sub-apertures

Set citation alerts for the article
Please enter your email address
© Copyright 2018-2021 | Chinese Laser Press. All Rights Reserved 沪ICP备15018463号-20