
Qi Zhang, Guohe Li, Yong Sun, Fei Sun. Experimental study on emissivity setting before precise temperature measurement of SiCp/Al cutting by infrared thermal imager[J]. Infrared and Laser Engineering, 2022, 51(6): 20210555
- Infrared and Laser Engineering
- Vol. 51, Issue 6, 20210555 (2022)
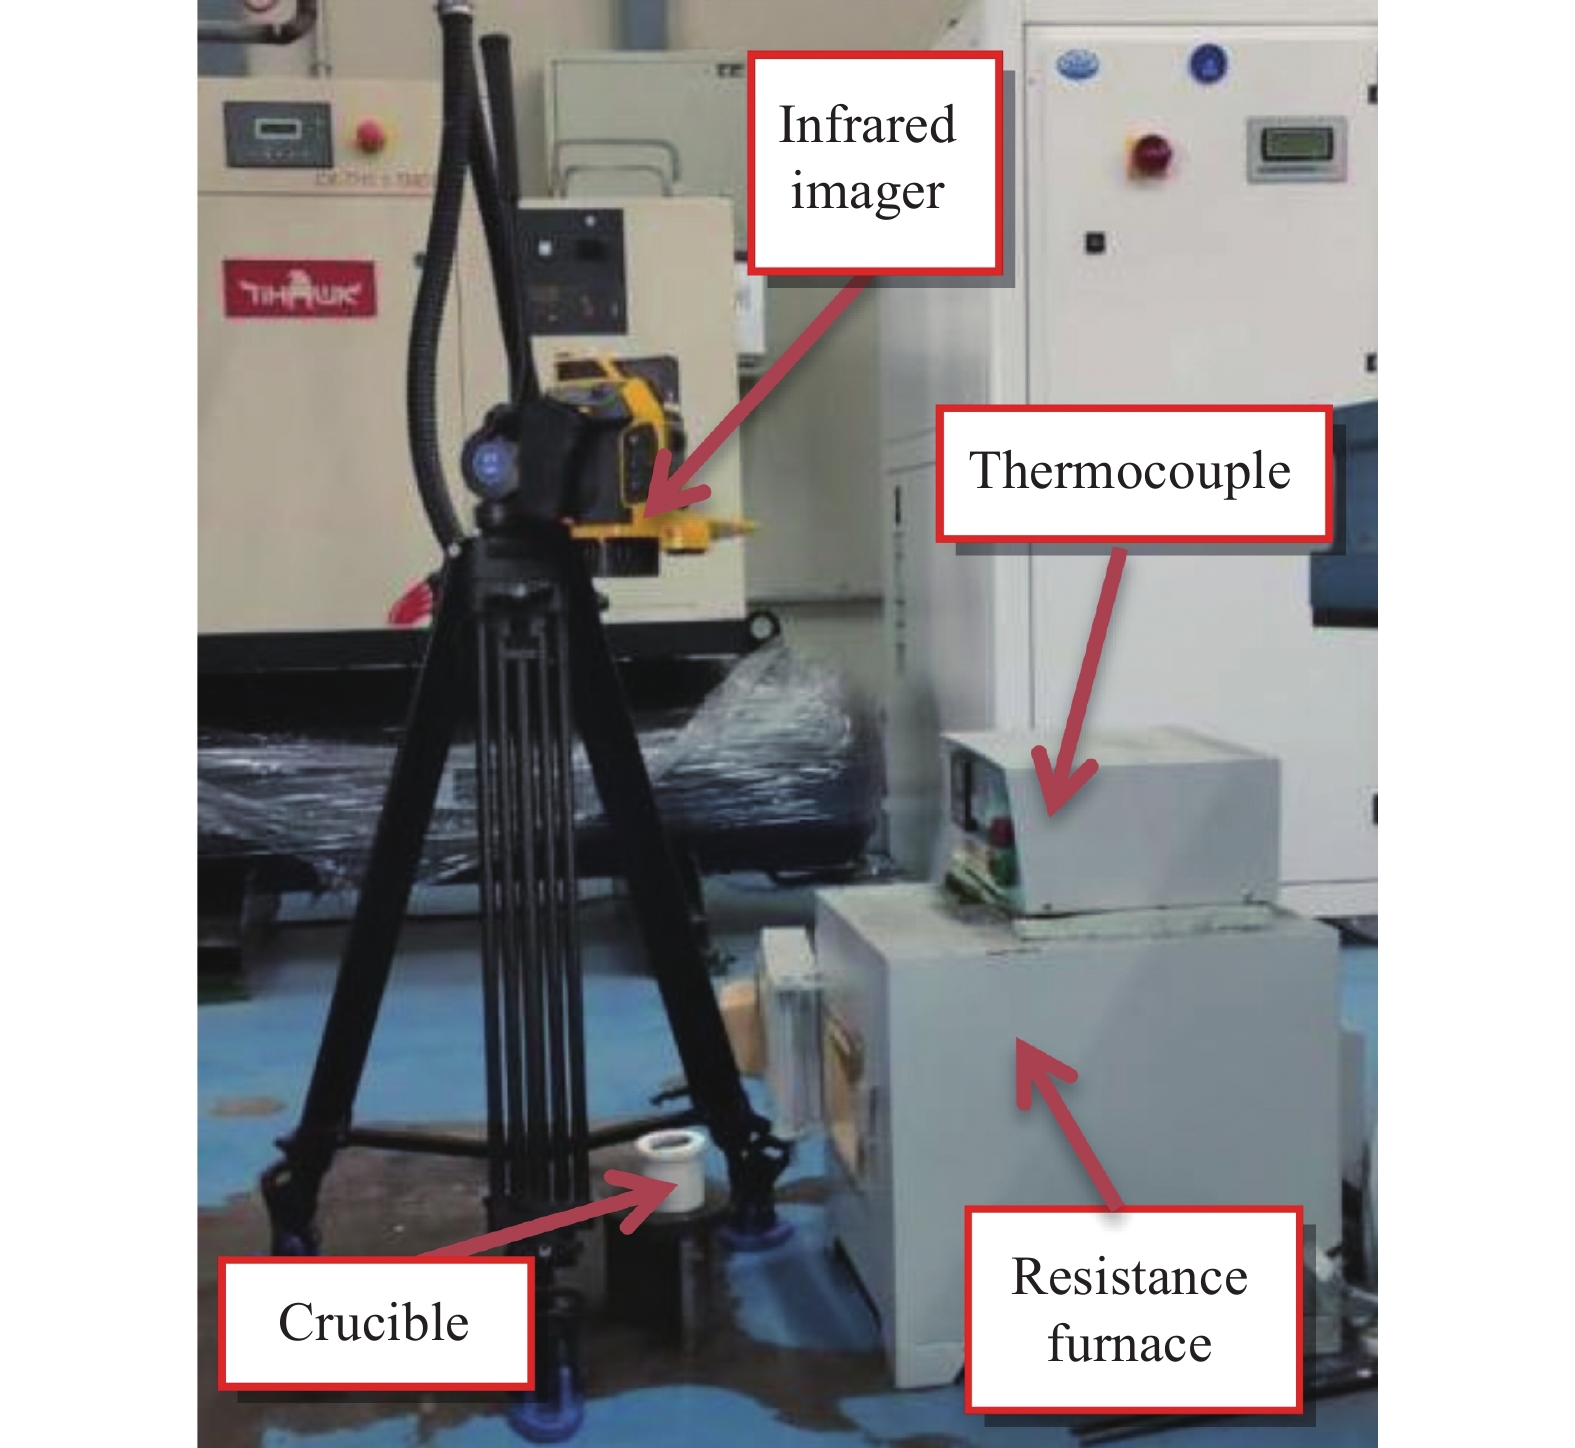
Fig. 1. Experimental device
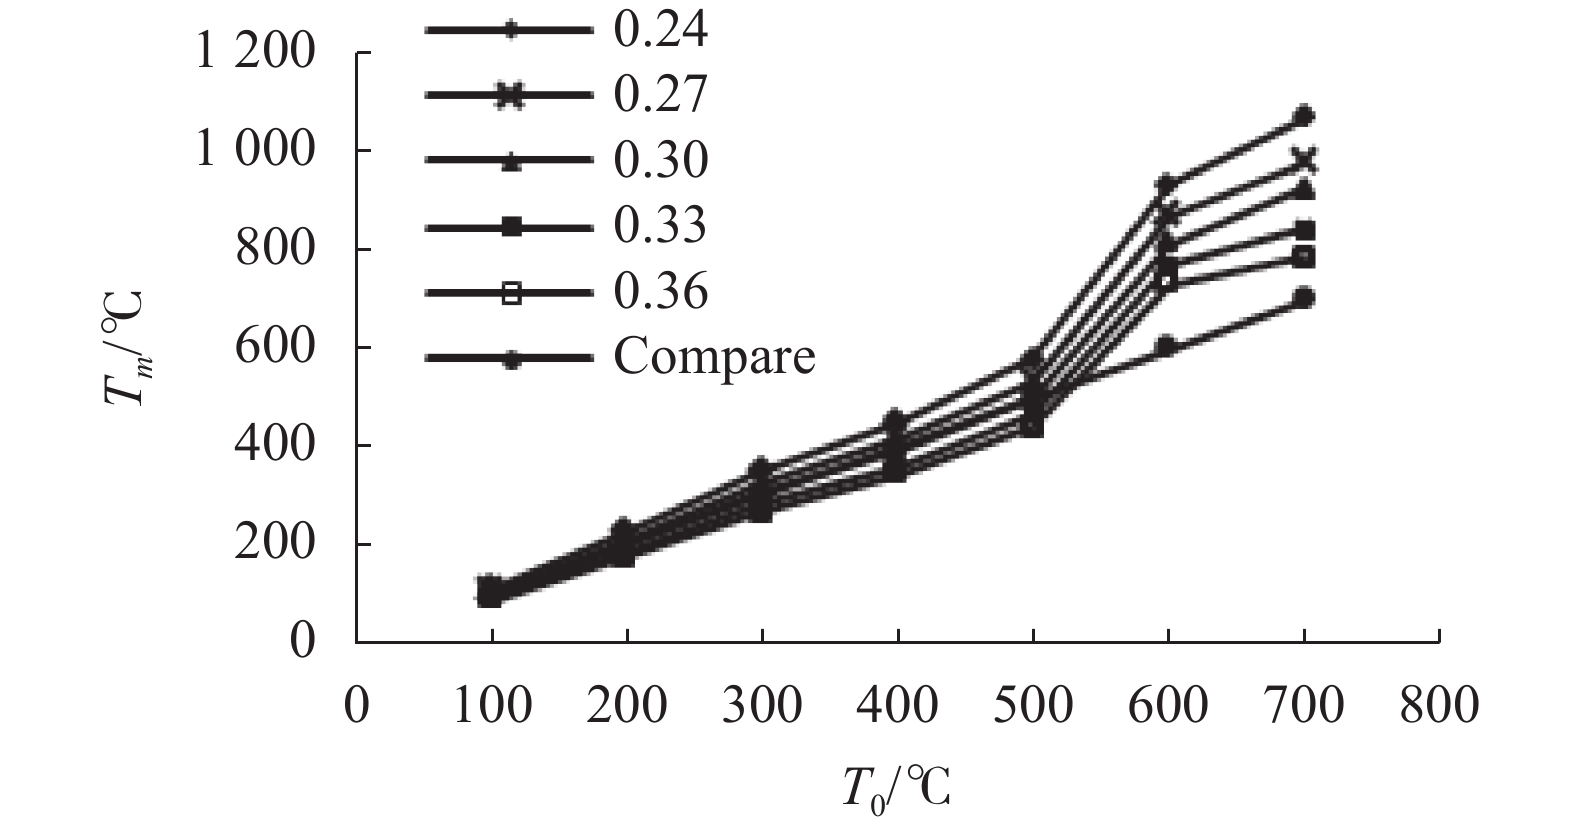
Fig. 2. Difference between measured and actual temperature when the emissivity is 0.3
Fig. 3. Measured object
Fig. 4. Effect of different emissivities on the measured temperature
Fig. 5. Geometric relationship between angle field w and measurement distance d
Fig. 6. Variation of emissivity
Fig. 7. Main response of the set emissivity
Fig. 8. Correction flow of the emissivity seting of infrared thermal imager
|
Table 1. Main technical parameters of fluke-Ti640 infrared thermal imager
|
Table 2. Basic properties of SiCp/Al composite
| |||||||||||||||
Table 3. Factorial experiment parameters
| ||||||||||||||||||||
Table 4. Orthogonal experimental factors and levels
|
Table 5. Range analysis
|
Table 6. Analysis of variance
|
Table 7. Experimental verification results
|
Table 8. Comparison of temperature measurement results
|
Table 9. Cutting experiment design
| ||||||||||||||||||||||||||||||||||||
Table 10. Comparison of cutting temperature before and after setting emissivity correction

Set citation alerts for the article
Please enter your email address
© Copyright 2018-2021 | Chinese Laser Press. All Rights Reserved 沪ICP备15018463号-20