
Juan Wang, Xiao-Tian Zhang, Ze-Mao Wu, Shu-Jin Deng, Hai-Bin Wu. Density fluctuations and sub-Poisson distribution in the ultracold Fermi gas of 6Li [J]. Acta Physica Sinica, 2020, 69(13): 136701-1
- Acta Physica Sinica
- Vol. 69, Issue 13, 136701-1 (2020)

Fig. 1. Imaging setup for noise measurements. The meaning of each symbol: FC: Fiber Collimator, PBS: polarization beam splitter, F1–F4: lens, OB: 5× imaging objective, CCD: charge coupled device.
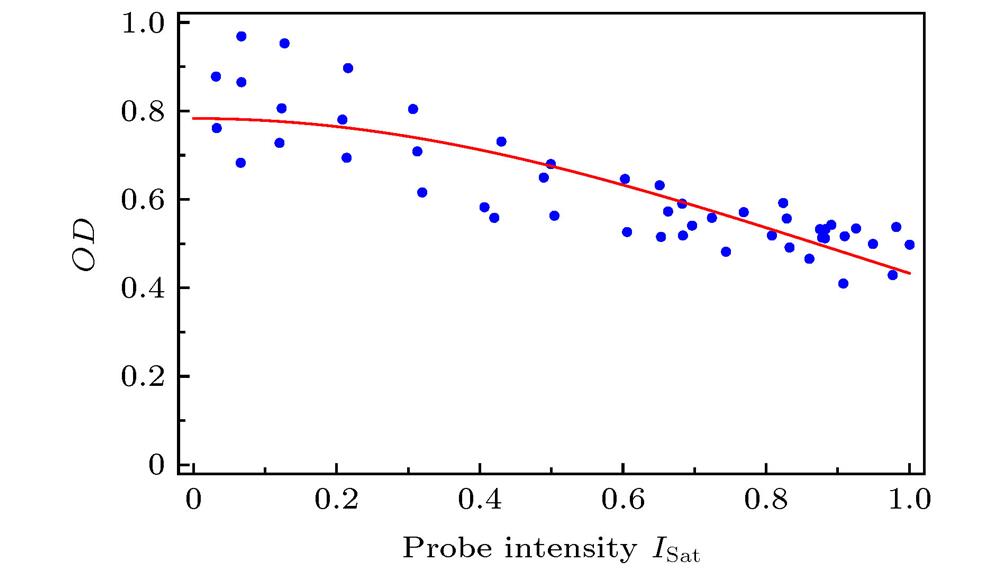
Fig. 2. The relationship between atomic OD and imaging light intensity. The blue point is the experimental data, and the red line is the fitting result of Gaussian formula.
Fig. 3. The relationship between the fluctuation of atomic number and the average atomic number at different temperatures. Red is high temperature
 , blue is low temperature
 , red dotted line is the fitting of high temperature data with low density, and the slope is 0.55, which reflects that the real scattering cross section of the system is 55% of the theoretical value.
, blue is low temperature
, red dotted line is the fitting of high temperature data with low density, and the slope is 0.55, which reflects that the real scattering cross section of the system is 55% of the theoretical value. Fig. 4. Comparison of atomic density and density fluctuation at different temperatures: (a)
 ; (b)
; (b)
 . In figure (a) (b), the distribution of atomic density is on the left, and the density fluctuation is on the right.
; (b)
. In figure (a) (b), the distribution of atomic density is on the left, and the density fluctuation is on the right. Fig. 5. Spatial distribution of atomic density and density fluctuation at different temperatures. The red line is the atomic density distribution and the blue line is the density fluctuation distribution.
Fig. 6. Density fluctuation with temperature. The blue point is the experimental result, where BIN = 8 and the dotted line is the theoretical curve.

Set citation alerts for the article
Please enter your email address
© Copyright 2018-2021 | Chinese Laser Press. All Rights Reserved 沪ICP备15018463号-20