• Acta Optica Sinica
  • Vol. 41, Issue 21, 2114002 (2021)
Jingfeng Ren1, Lingzhen Yang1、2、*, Wanghua Zhu1, Linlin Fan1, Weijie Ding1、3, and Juanfen Wang1
Author Affiliations
  • 1College of Physics and Optoelectronics, Taiyuan University of Technology, Taiyuan, Shanxi 0 30024, China
  • 2Key Laboratory of Advanced Transducers and Intelligent Control System, Ministry of Education, Taiyuan University of Technology, Taiyuan, Shanxi 0 30024, China
  • 3Xinzhou Teachers University, Xinzhou, Shanxi 0 34000, China
  • show less
    DOI: 10.3788/AOS202141.2114002 Cite this Article Set citation alerts
    Jingfeng Ren, Lingzhen Yang, Wanghua Zhu, Linlin Fan, Weijie Ding, Juanfen Wang. Chaotic Characteristics of Erbium-Doped Fiber Laser with Optical Injection[J]. Acta Optica Sinica, 2021, 41(21): 2114002 Copy Citation Text show less
    Schematic of experimental setup of chaotic fiber laser with optical injection
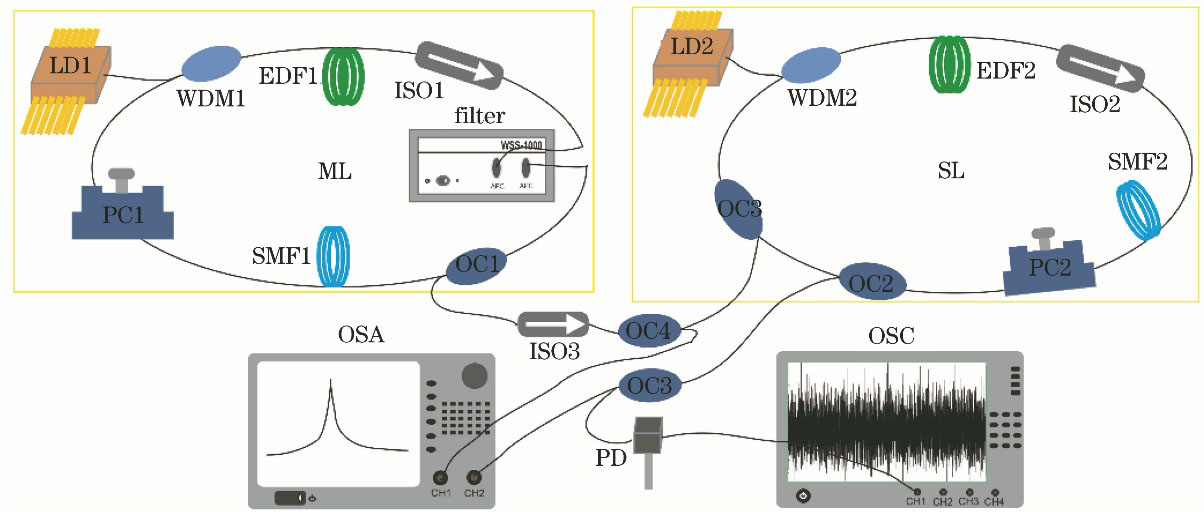
    Fig. 1. Schematic of experimental setup of chaotic fiber laser with optical injection
    HPE and RSDOPE values of chaotic laser output varying with different pump currents, the insets show the autocorrelation of chaotic signals with pump current of 280 mA and 420 mA respectively. (a) Master laser; (b) slave laser
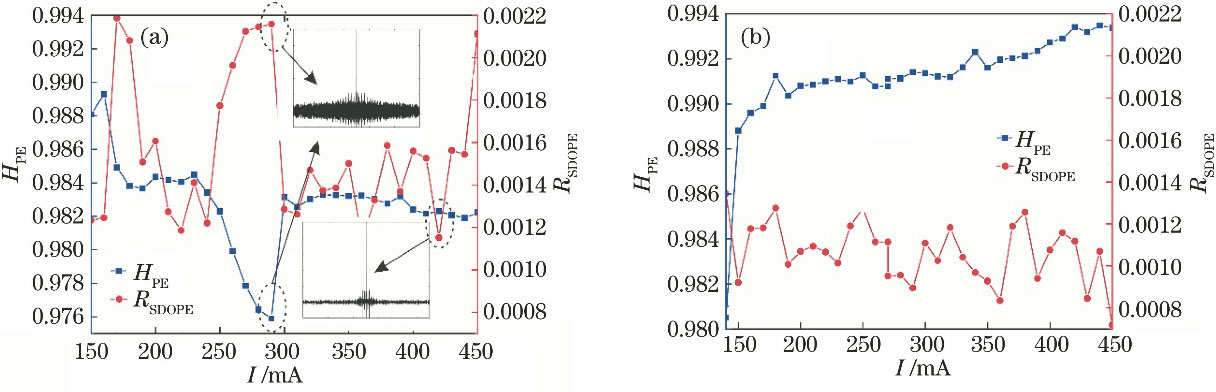
    Fig. 2. HPE and RSDOPE values of chaotic laser output varying with different pump currents, the insets show the autocorrelation of chaotic signals with pump current of 280 mA and 420 mA respectively. (a) Master laser; (b) slave laser
    Output spectra,HPE, and RSDOPE of chaotic signals with different wavelength detuning. (a) Output spectra; (b) HPE and RSDOPE
    Fig. 3. Output spectra,HPE, and RSDOPE of chaotic signals with different wavelength detuning. (a) Output spectra; (b) HPE and RSDOPE
    HPE and RSDOPE of chaotic signals changed with different injection power ratios
    Fig. 4. HPE and RSDOPE of chaotic signals changed with different injection power ratios
    Basic characteristics of chaotic signal when the injection power ratio is 0.15. (a) Sequence diagram; (b) RF spectrum; (c) autocorrelation curve; (d) spectrum
    Fig. 5. Basic characteristics of chaotic signal when the injection power ratio is 0.15. (a) Sequence diagram; (b) RF spectrum; (c) autocorrelation curve; (d) spectrum
    Characteristics of chaotic signal after optical injection. (a) Time series frequency distribution and Gaussian fitting curve; (b) RF spectrum; (c) autocorrelation curve
    Fig. 6. Characteristics of chaotic signal after optical injection. (a) Time series frequency distribution and Gaussian fitting curve; (b) RF spectrum; (c) autocorrelation curve
    Jingfeng Ren, Lingzhen Yang, Wanghua Zhu, Linlin Fan, Weijie Ding, Juanfen Wang. Chaotic Characteristics of Erbium-Doped Fiber Laser with Optical Injection[J]. Acta Optica Sinica, 2021, 41(21): 2114002
    Download Citation