
Guangbao Tian, Jian Wang, Bowen Wang. Monocular camera non-cooperative target extraction and pose detection[J]. Infrared and Laser Engineering, 2021, 50(12): 20210166
- Infrared and Laser Engineering
- Vol. 50, Issue 12, 20210166 (2021)
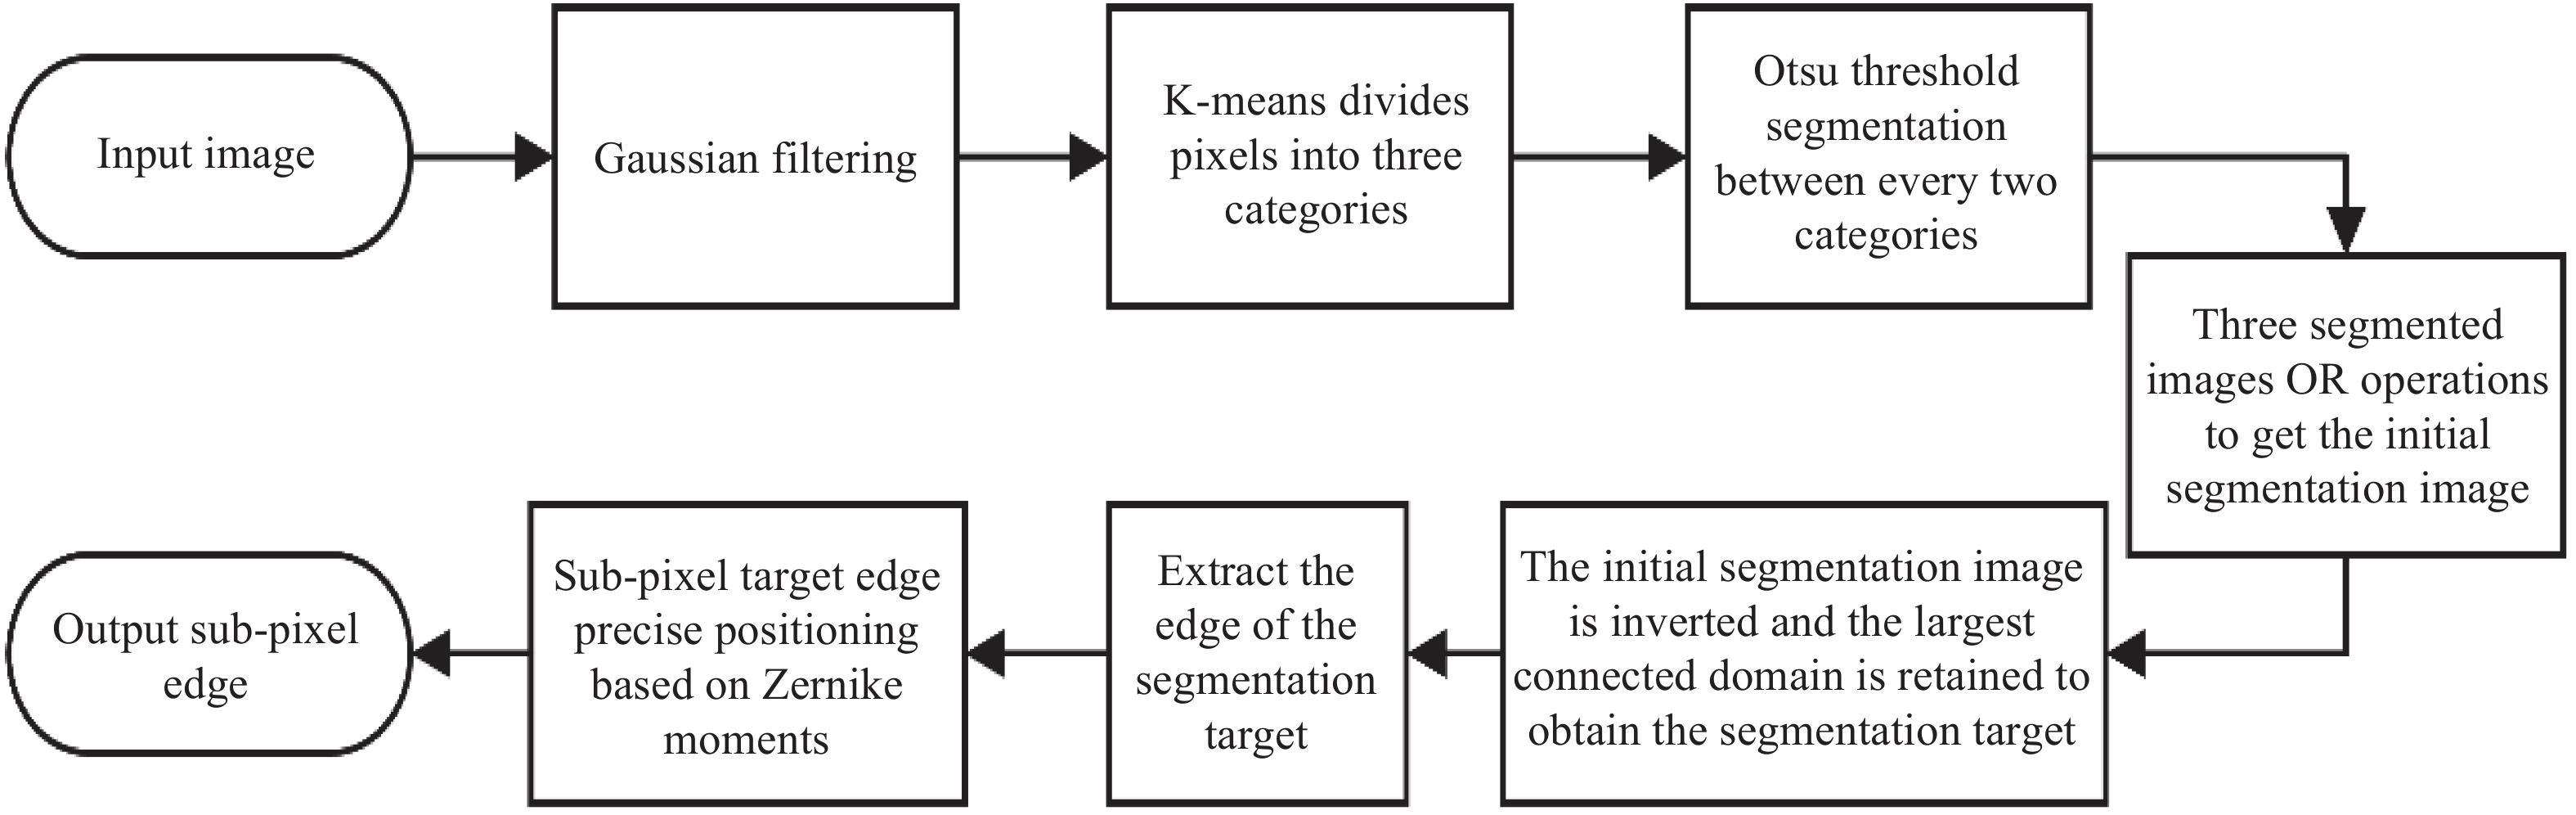
Fig. 1. Image segmentation and sub-pixel edge positioning process
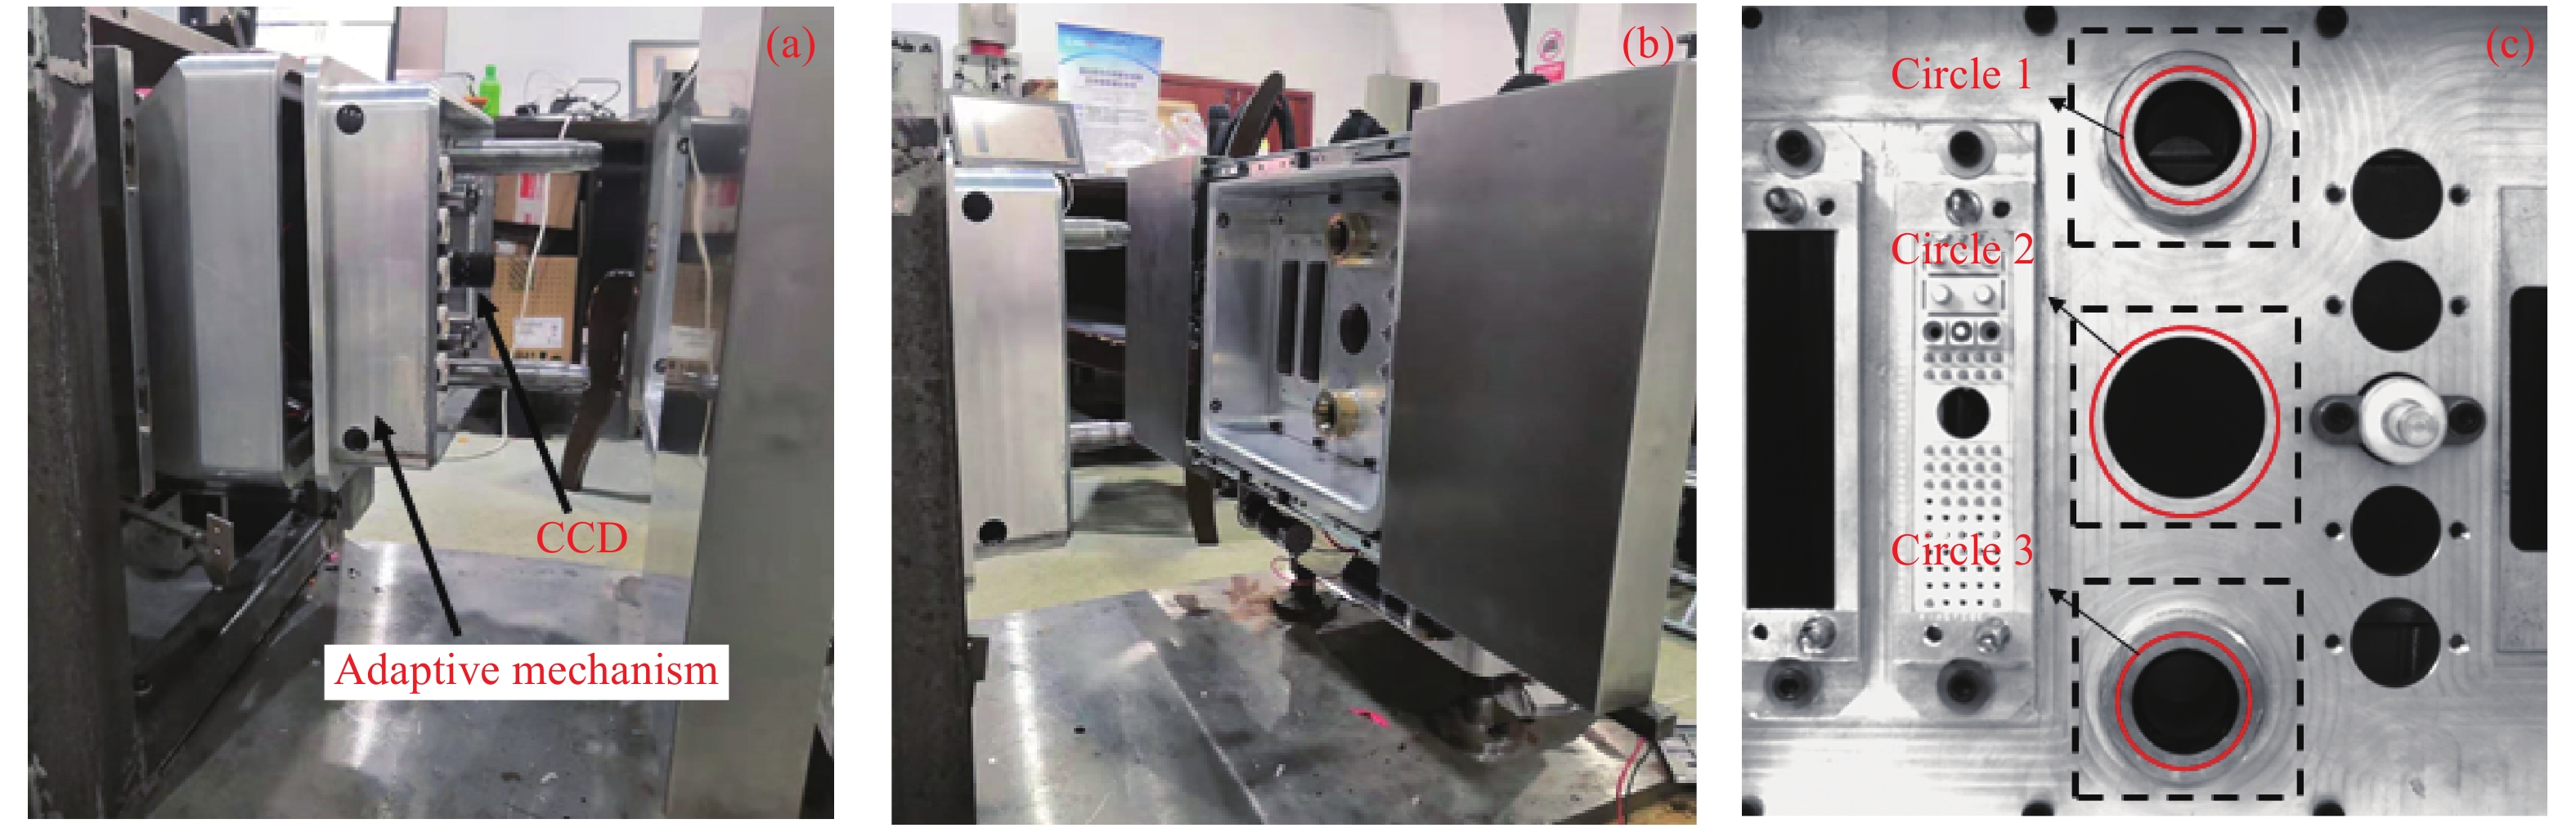
Fig. 2. Original equipment image. (a) Actuator; (b) Receiver; (c) Features on the receiver
Fig. 3. [in Chinese]
Fig. 3. Pictures under different settings. (a) Images with different exposures in the same position; (b) Images with different positions in the same exposure
Fig. 4. Image of threshold segmentation process after classification. (a) Original image; (b) Image after clustering; (c) Results of segmentation of class 1 and class 3 pixel values; (d) Results of segmentation of class 1 and class 2 pixel values; (e) Results of class 2 and class 3 pixel value segmentation; (f) The result of XOR of figure (d) and figure (e); (g) Results of figure (c), figure (d), figure (e) or operation; (h) The target obtained by removing the pseudo-connected components according to the area relationship of the connected components after inverting figure (g)
Fig. 5. Comparison of various segmentation methods. The picture corresponds to circle 3 in the first picture in the first row in Fig. 4 . (a) Otsu; (b) Global histogram threshold using Otsu's method; (c) Multilevel image thresholds using Otsu’s method; (d) Iterative threshold segmentation method; (e) DRLSE algorithm[18]; (f) Proposed method
Fig. 6. Sub-pixel edge detection ideal step model. (a) Original edge image; (b) Rotated edge image
Fig. 7. Edge detail. (a) A corner of the checkerboard calibration board; (b) Zernike sub-pixel edges and thresholded edges after classification
Fig. 8. Diagram of pose solution
Fig. 9. Measurement error data of different methods under different exposures. (a) The standard deviation of measurement error of different methods; (b) Maximum deviation of measurement error of different methods
Fig. 10. Zernike method attitude data at different positions of the same exposure. (a) Standard deviation of attitude; (b) Maximum deviation of attitude; (c) Mean attitude
Fig. 11. The measurement error data of different size masks under different exposures. (a) The standard deviation of the measurement error of different size masks; (b) The maximum deviation of the measurement error of different size masks

Set citation alerts for the article
Please enter your email address
© Copyright 2018-2021 | Chinese Laser Press. All Rights Reserved 沪ICP备15018463号-20