• Acta Optica Sinica
  • Vol. 41, Issue 11, 1112002 (2021)
Zhenxiong Jian, Xi Wang, Jieji Ren, and Mingjun Ren*
Author Affiliations
  • School of Mechanical Engineering, Shanghai Jiao Tong University, Shanghai 200240, China
  • show less
    DOI: 10.3788/AOS202141.1112002 Cite this Article Set citation alerts
    Zhenxiong Jian, Xi Wang, Jieji Ren, Mingjun Ren. Metal Surface Texture Reconstruction Based on Near-Field Photometric Stereo[J]. Acta Optica Sinica, 2021, 41(11): 1112002 Copy Citation Text show less
    Schematic of BRDF simulation
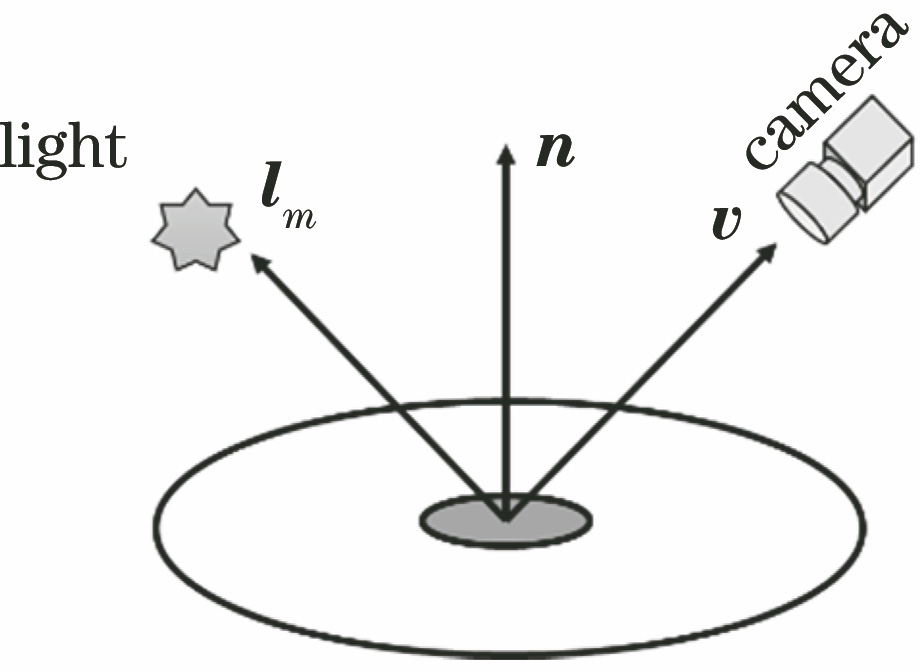
    Fig. 1. Schematic of BRDF simulation
    Imaging path of object in near-field photometric stereo vision scene[8]
    Fig. 2. Imaging path of object in near-field photometric stereo vision scene[8]
    Quasi point source emitting light in any direction
    Fig. 3. Quasi point source emitting light in any direction
    Metal surface texture reconstruction process based on near-plane near-field photometric stereoscopic vision
    Fig. 4. Metal surface texture reconstruction process based on near-plane near-field photometric stereoscopic vision
    Diagram of shooting scene
    Fig. 5. Diagram of shooting scene
    Near-field non-Lambert photometric stereo vision network based on co-location light source
    Fig. 6. Near-field non-Lambert photometric stereo vision network based on co-location light source
    Schematic of near-field photometric stereo vision device
    Fig. 7. Schematic of near-field photometric stereo vision device
    Simulation results. (a) True value of normal vector; (b) predicted value of normal vector; (c) angle error of normal vector; (d) truth value of surface texture; (e) surface texture reconstruction value; (f) surface texture error; (g) sectional profile extracted from Fig. (d); (h) sectional profile extracted from Fig. (e)
    Fig. 8. Simulation results. (a) True value of normal vector; (b) predicted value of normal vector; (c) angle error of normal vector; (d) truth value of surface texture; (e) surface texture reconstruction value; (f) surface texture error; (g) sectional profile extracted from Fig. (d); (h) sectional profile extracted from Fig. (e)
    Error statistics of simulation results. (a) MAE of surface normal vector; (b) RMS relative error of surface texture depth value
    Fig. 9. Error statistics of simulation results. (a) MAE of surface normal vector; (b) RMS relative error of surface texture depth value
    Experimental results of stainless steel end milling sample No. 1. (a) Sample photographs; (b) normal vector graph; (c) surface textures as measured by white light interferometer; (d) surface texture measured by proposed method; (e) sectional profile from Fig. (c); (f) sectional profile from Fig. (d)
    Fig. 10. Experimental results of stainless steel end milling sample No. 1. (a) Sample photographs; (b) normal vector graph; (c) surface textures as measured by white light interferometer; (d) surface texture measured by proposed method; (e) sectional profile from Fig. (c); (f) sectional profile from Fig. (d)
    Experimental results of aluminum alloy end milling sample No. 2. (a) Sample photographs; (b) normal vector graph; (c) surface textures as measured by white light interferometer; (d) surface texture measured by proposed method; (e) sectional profile from Fig. (c); (f) sectional profile from Fig. (d)
    Fig. 11. Experimental results of aluminum alloy end milling sample No. 2. (a) Sample photographs; (b) normal vector graph; (c) surface textures as measured by white light interferometer; (d) surface texture measured by proposed method; (e) sectional profile from Fig. (c); (f) sectional profile from Fig. (d)
    Experimental results in different areas of field of view. (a) Measurement of regional distribution; (b) surface textures as measured by white light interferometer; surface textures measured by proposed method in (c) region 1, (d) region 2, (e) region 3, (f) region 4, and (g) region 5
    Fig. 12. Experimental results in different areas of field of view. (a) Measurement of regional distribution; (b) surface textures as measured by white light interferometer; surface textures measured by proposed method in (c) region 1, (d) region 2, (e) region 3, (f) region 4, and (g) region 5
    Part nameRMS of white lightinterferometer /μmRMS of proposedmethod /μmRelative error /%
    SS planning 16.656.521.95
    SS planning 23.473.304.90
    SS planning 31.981.990.51
    SS milling 16.956.536.04
    SS milling 23.222.919.63
    SS milling 30.981.2729.59
    AA milling 15.926.102.94
    AA milling 25.614.9511.67
    AA milling 33.633.1413.27
    Table 1. Statistics of different measurement results
    Area No.RMS of proposedmethod /μmRelativeerror /%
    16.521.95
    26.610.55
    36.571.17
    46.741.30
    56.413.56
    Table 2. Statistics of measurement results in different areas
    Zhenxiong Jian, Xi Wang, Jieji Ren, Mingjun Ren. Metal Surface Texture Reconstruction Based on Near-Field Photometric Stereo[J]. Acta Optica Sinica, 2021, 41(11): 1112002
    Download Citation