• Infrared and Laser Engineering
  • Vol. 50, Issue 5, 20200318 (2021)
Dongyan Zhang1, Zhen Dai1、2, Xingang Xu2、*, Guijun Yang2, Yang Meng2, Haikuan Feng2, Qi Hong1, and Fei Jiang1、3
Author Affiliations
  • 1National Engineering Research Center for Agro-Ecological Big Data Analysis & Application, Anhui University, Hefei 230601, China
  • 2Beijing Agricultural Information Technology Research Center, Beijing 100097, China
  • 3School of Information Engineering, Suzhou University, Suzhou 234000, China
  • show less
    DOI: 10.3788/IRLA20200318 Cite this Article
    Dongyan Zhang, Zhen Dai, Xingang Xu, Guijun Yang, Yang Meng, Haikuan Feng, Qi Hong, Fei Jiang. Crop classification of modern agricultural park based on time-series Sentinel-2 images[J]. Infrared and Laser Engineering, 2021, 50(5): 20200318 Copy Citation Text show less
    Geographical location and sample distributions of the study area
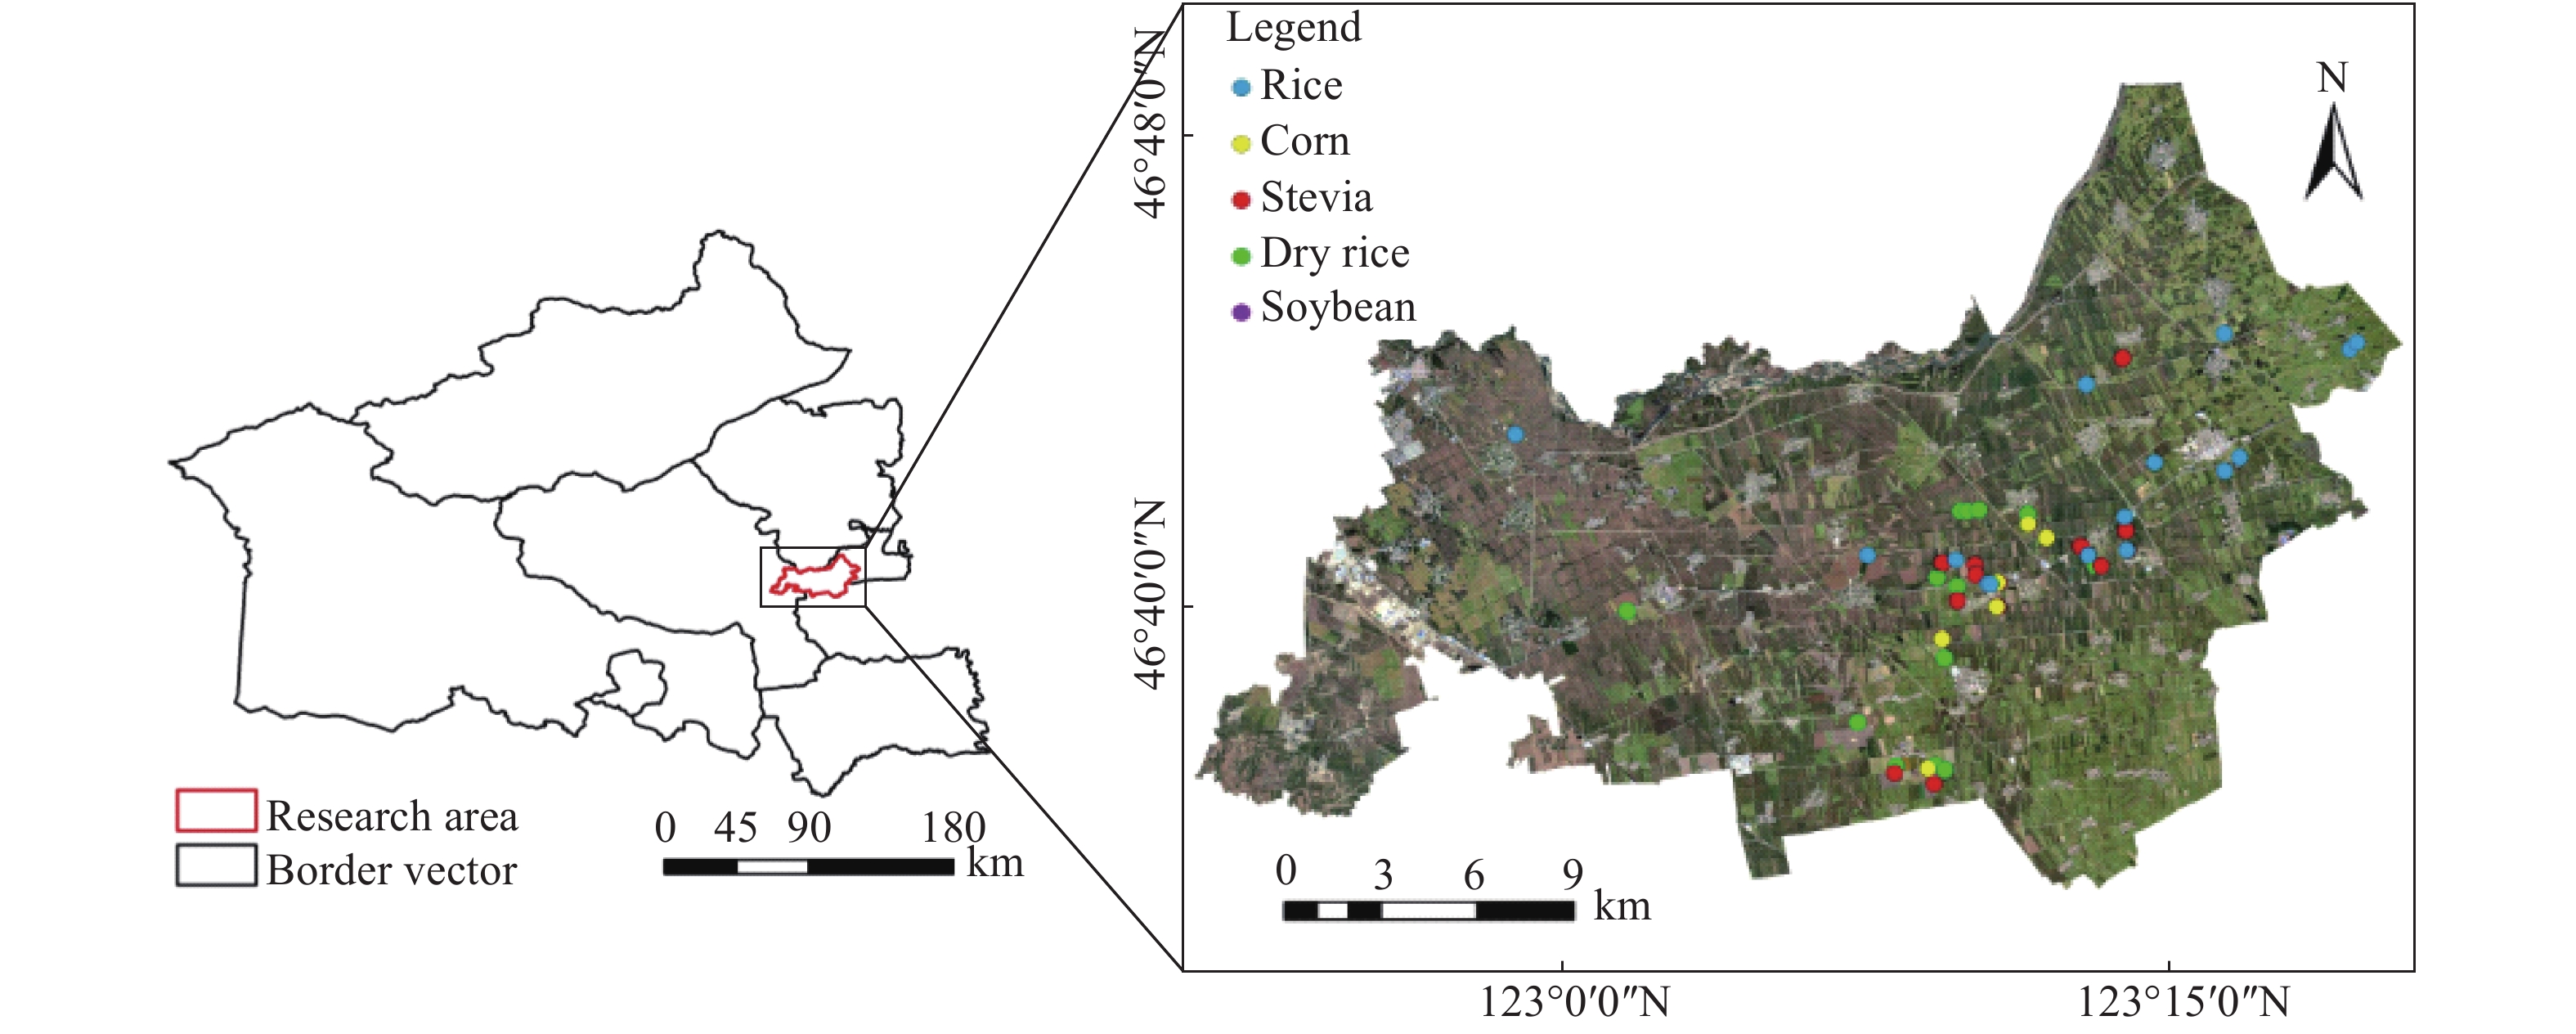
    Fig. 1. Geographical location and sample distributions of the study area
    Temporal changes of NDVI (a), RVI (b), EVI (c) and Ref (NIR) (d) for main crops
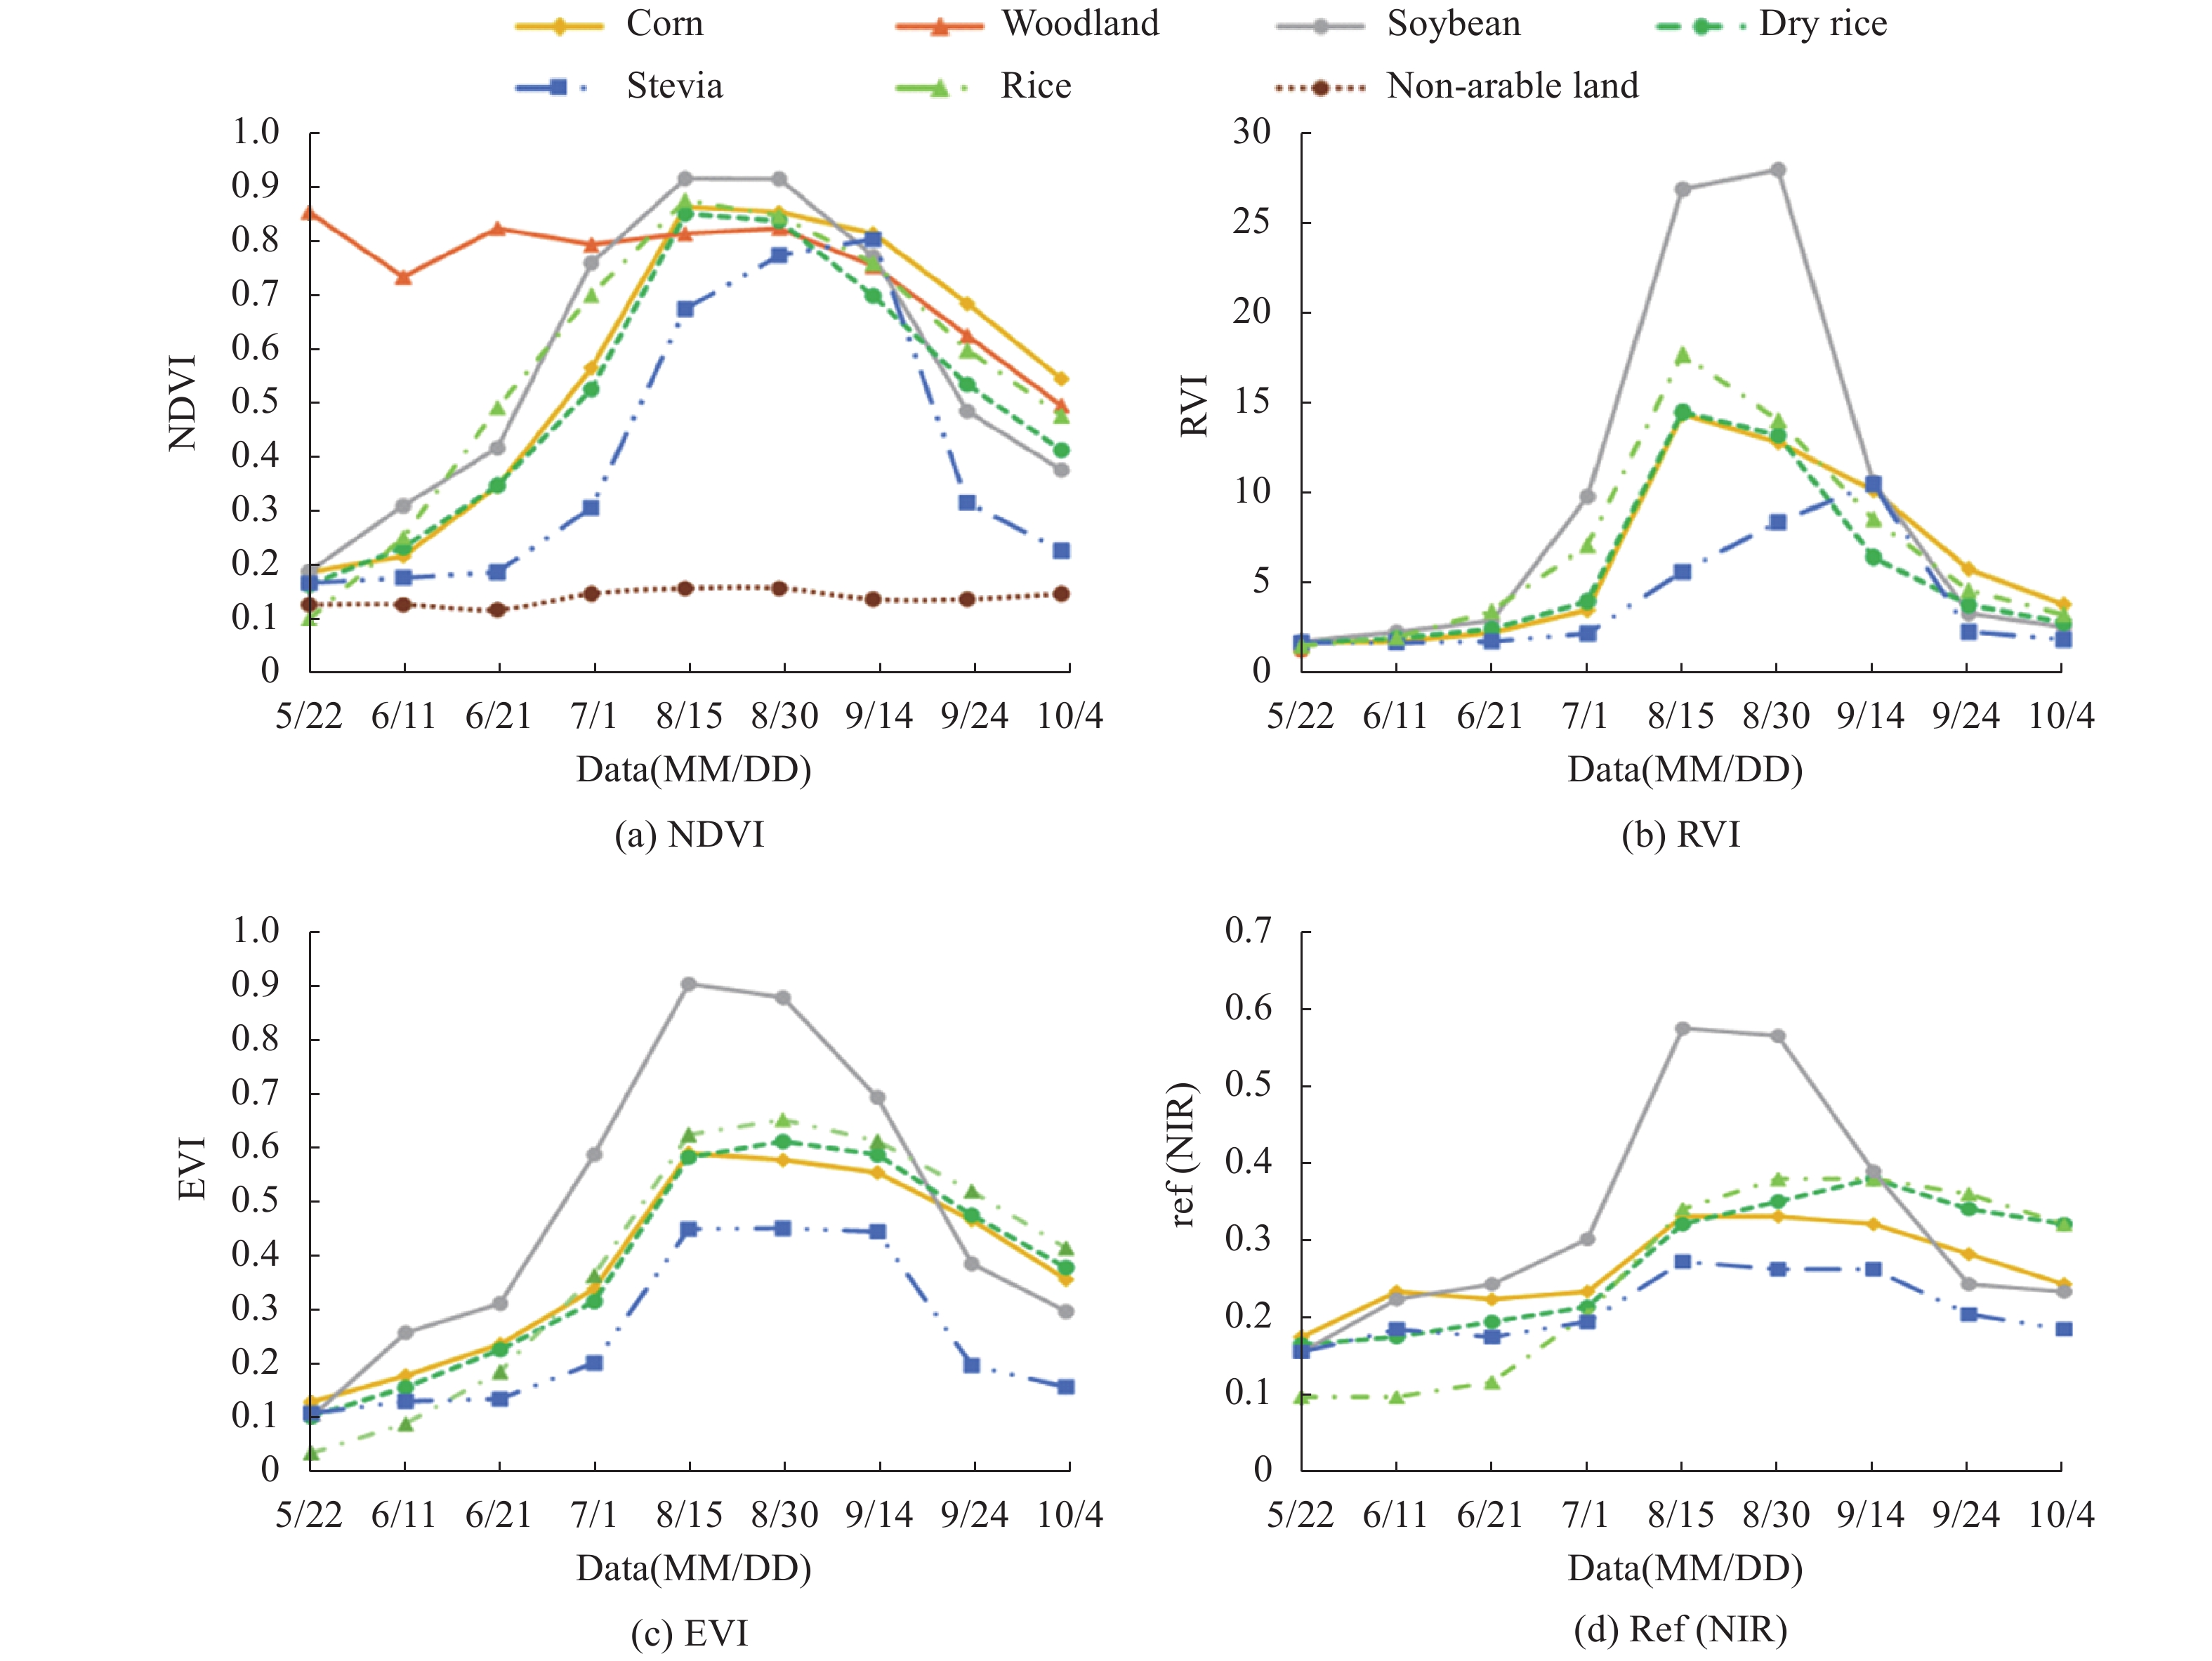
    Fig. 2. Temporal changes of NDVI (a), RVI (b), EVI (c) and Ref (NIR) (d) for main crops
    Flow chart of crop classification extraction
    Fig. 3. Flow chart of crop classification extraction
    Crop classification results using Decision Tree (a), Random Forest (b), Support Vector Machine (c), Maximum Likelihood (d)
    Fig. 4. Crop classification results using Decision Tree (a), Random Forest (b), Support Vector Machine (c), Maximum Likelihood (d)
    TypeMayJuneJulyAugustSeptemberOctober
    EMLEMLEMLEMLEMLEM
    Note: E means the early 10 days of a month,M is the middle 10 days,and L represents the lately 10 days.
    RiceSowingTilleringHeadingFillingMaturity
    SoybeanSowingSeedingFloweringPoddingFillingMaturity
    SteviaTransplantingBranchingFloweringMaturity
    CornSowingSeedingJointingTasselingFillingMaturity
    Dry riceSowingTilleringHeadingFillingMaturity
    Table 1. Growth period of five crops in the study area
    Data timeSensorQuality
    2019-05-22Sentinel-2ABest
    2019-06-11Sentinel-2AGood
    2019-06-21Sentinel-2ABest
    2019-07-01Sentinel-2AGood
    2019-08-15Sentinel-2BBest
    2019-08-30Sentinel-2ABest
    2019-09-14Sentinel-2BBest
    2019-09-24Sentinel-2BBest
    2019-10-04Sentinel-2BBest
    Table 2. Data lists of Sentinel-2 images
    Sentinel-2 bandsWavelength/μmReflection/m
    Band1-Coastal aerosol0.44360
    Band2-Blue0.49010
    Band3-Green0.56010
    Band4-Red0.66510
    Band5-Vegetation red edge0.70520
    Band6-Vegetation red edge0.74020
    Band7-Vegetation red edge0.78320
    Band8-NIR0.84210
    Band8A-Vegetation red edge0.86520
    Band9-Water vapour0.94560
    Band10-SWIR-Cirrus1.37560
    Band11-SWIR11.61020
    Band12-SWIR22.19020
    Table 3. Spectral bands of the Sentinel-2 sensors (S2A & S2B)
    IndicatorDescriptionSource
    Notes: In the formula, $ {\mathrm{\rho }}_{\mathrm{N}\mathrm{I}\mathrm{R}} $ is the near-infrared band reflectivity, $ {\mathrm{\rho }}_{\mathrm{R}\mathrm{E}\mathrm{D}} $ is the red band reflectivity, $ {\mathrm{\rho }}_{\mathrm{B}\mathrm{L}\mathrm{U}\mathrm{E}} $ is the blue band reflectivity and L is the soil adjustment coefficient of 1.
    Normalized Difference Vegetation Index(NDVI)${\rm NDVI} = \dfrac{ { {\rho _{\rm NIR} } - {\rho _{\rm RED} } } }{ { {\rho _{\rm NIR} } + {\rho _{\rm RED} } } }$Ref.[15]
    Ratio Vegetation Index(RVI)${\rm RVI} = \dfrac{ { {\rho _{\rm NIR} } } }{ { {\rho _{\rm RED} } } }$Ref. [16]
    Enhanced Vegetation Index(EVI)${\rm EVI} = 2.5×\dfrac{ { {\rho _{\rm NIR} } - {\rho _{\rm RED} } } }{ { {\rho _{\rm NIR} } + 6.0×{\rho _{\rm RED} } - 7.5×{\rho _{\rm BLUE} } + L} }$Ref. [17-18]
    Near Infrared Ray(Ref(NIR))The reflection of Band-8 in Tab.3Ref. [19]
    Table 4. Classification indicators used in the study
    TypeCalculation formula
    Notes: where k represents the number of rows and columns of the confusion matrix, Xii represents the value on the diagonal of the confusion matrix that is the number of pixels correctly classified,N represents the total number of pixels verified, Xi represents the i row of the confusion matrix. The sum of elements, Xj represents the sum of elements in the j column of the confusion matrix.
    Mapping accuracy$\mathrm{P}\mathrm{A}=\dfrac{ {X}_{ii} }{ {X}_{j} }×100\%$
    User accuracy$\mathrm{U}\mathrm{A}=\dfrac{ {X}_{ii} }{ {X}_{i} }×100\%$
    Overall accuracy$\mathrm{O}\mathrm{A}=\displaystyle\sum _{i=1}^{k}\dfrac{ {X}_{ii} }{N}×100\%$
    Kappa coefficient${{K} } = \dfrac{ {N\displaystyle\sum\nolimits_{i = 1}^k { {X_{ii} } } - \sum\nolimits_{i = 1}^k { {X_i}{X_j} } } }{ { {N^2} - \displaystyle\sum\nolimits_{i = 1}^k { {X_i}{X_j} } } }$
    Table 5. Formulas of accuracy evaluation
    TypeSoybeanRiceSteviaCornDry riceTotalUser accuracy
    Soybean3288400320361291.03%
    Rice056801633176590596.19%
    Stevia002039059209897.19%
    Corn0108451221867397.44%
    Dry rice8914710554820603979.81%
    Mapping accuracy99.76%99.75%92.60%88.57%86.13%
    Table 6. Confusion matrix result of Decision Tree
    TypeSoybeanRiceSteviaCornDry riceTotalUser accuracy
    Soybean3294000393368789.34%
    Rice0569219183216611093.16%
    Stevia00199308200199.60%
    Corn002930141934499.54%
    Dry rice421421024938518895.18%
    Mapping accuracy99.88%99.96%92.44%97.03%88.24%
    Table 7. Confusion matrix result of Random Forest
    Classification methodOverall accuracyKappa coefficient
    Maximum Likelihood86.5%0.823
    Support Vector Machine91.6%0.890
    Decision Tree92.2%0.897
    Random Forest95.8%0.944
    Table 8. Overall accuracy estimation and Kappa coefficient of classification based on each method
    Dongyan Zhang, Zhen Dai, Xingang Xu, Guijun Yang, Yang Meng, Haikuan Feng, Qi Hong, Fei Jiang. Crop classification of modern agricultural park based on time-series Sentinel-2 images[J]. Infrared and Laser Engineering, 2021, 50(5): 20200318
    Download Citation