
Katerina Falk. Experimental methods for warm dense matter research[J]. High Power Laser Science and Engineering, 2018, 6(4): 04000e59
- High Power Laser Science and Engineering
- Vol. 6, Issue 4, 04000e59 (2018)
![Phase diagram for the WDM regime. WDM lies between condensed matter, hot dense matter and ideal plasma (low densities), and overlaps the planar laser-generated shocks in matter as well as the astrophysical conditions. $\unicode[STIX]{x1D6E4}$ is the coupling parameter (ratio of Coulomb and thermal energy) so the $\unicode[STIX]{x1D6E4}=1$ line separates the strongly and weakly coupled regimes, and $\unicode[STIX]{x1D707}$ stands for the chemical potential where the $\unicode[STIX]{x1D707}=0$ line signifies the area where the Fermi energy equals $k_{B}T$, below which we get Fermi degenerate matter.](/richHtml/hpl/2018/6/4/04000e59/img_1.gif)
Fig. 1. Phase diagram for the WDM regime. WDM lies between condensed matter, hot dense matter and ideal plasma (low densities), and overlaps the planar laser-generated shocks in matter as well as the astrophysical conditions. $\unicode[STIX]{x1D6E4}$ is the coupling parameter (ratio of Coulomb and thermal energy) so the $\unicode[STIX]{x1D6E4}=1$ line separates the strongly and weakly coupled regimes, and $\unicode[STIX]{x1D707}$ stands for the chemical potential where the $\unicode[STIX]{x1D707}=0$ line signifies the area where the Fermi energy equals $k_{B}T$ , below which we get Fermi degenerate matter.
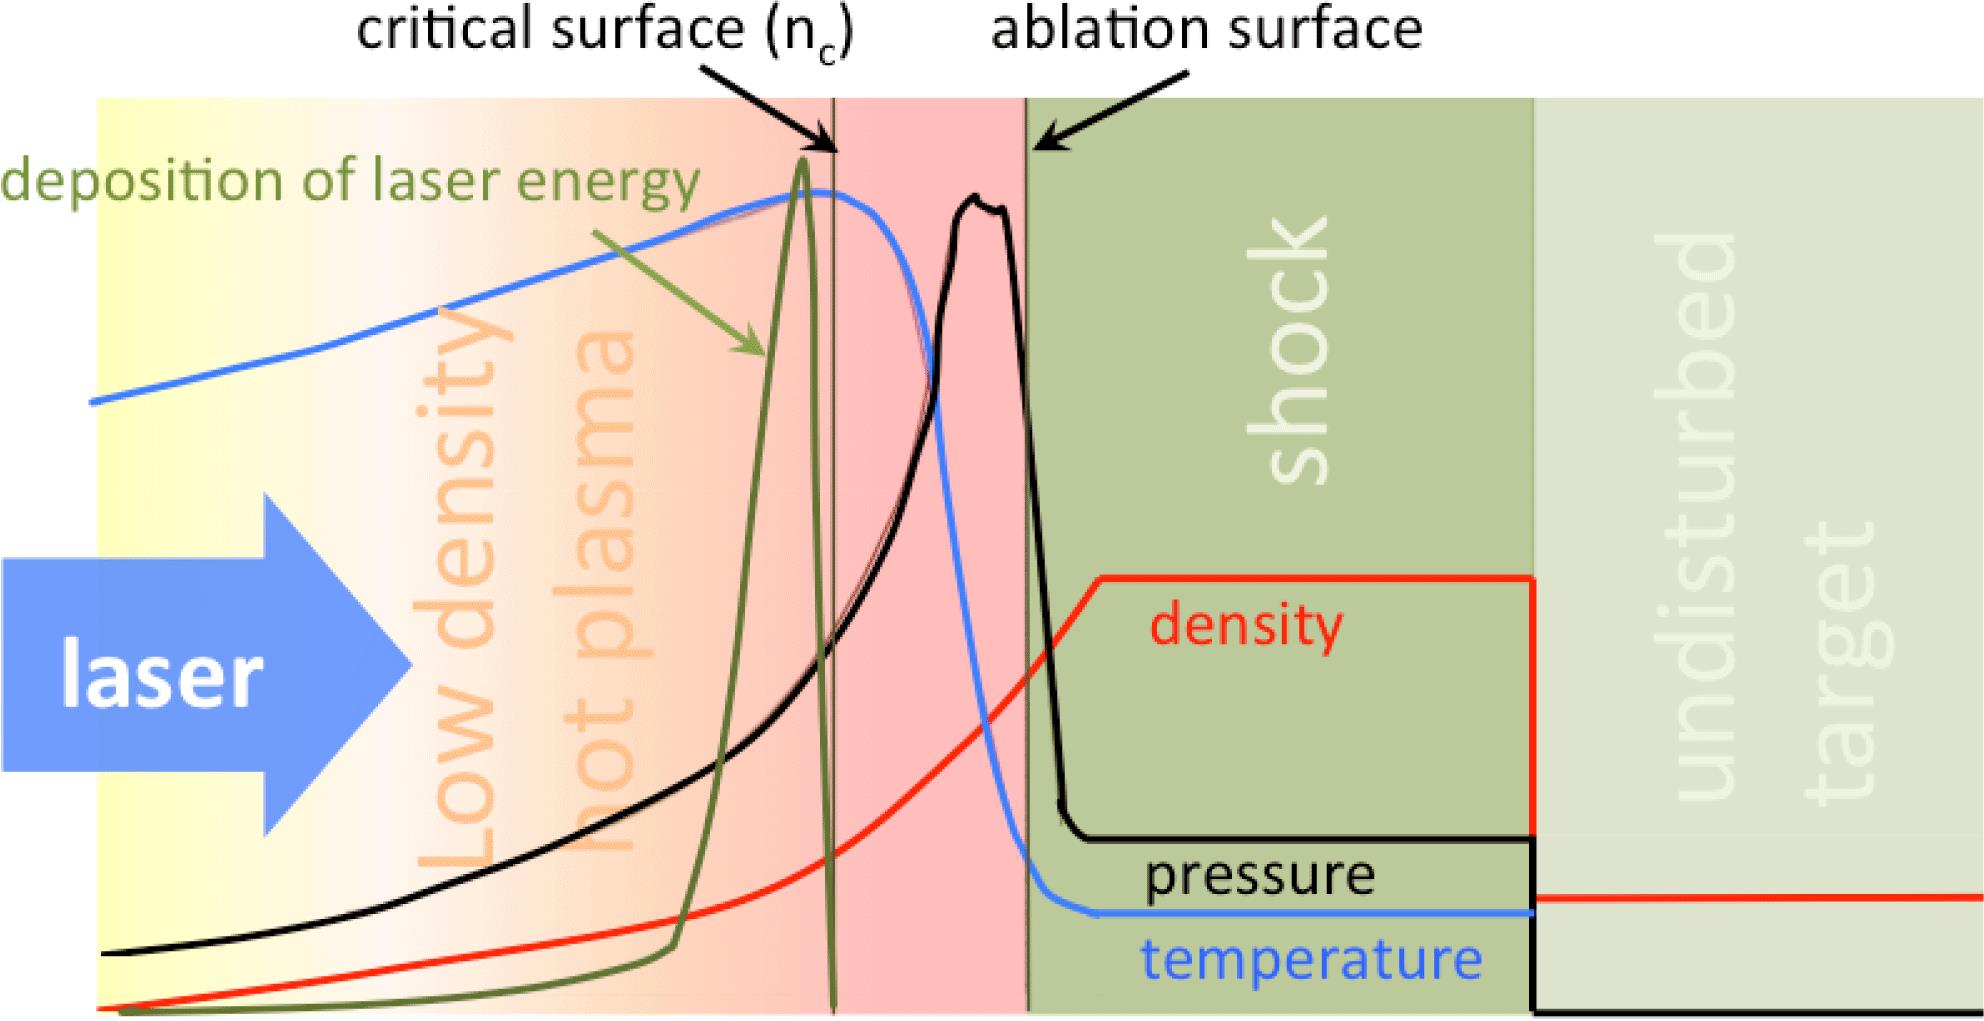
Fig. 2. Diagram of interaction between a solid/liquid target and a laser showing ablation of the surface material. The laser light can only propagate through the plasma up to the critical density $n_{c}$ at the critical surface, where it is reflected. The highest temperature is found at the critical surface. The temperature then drops between the critical surface and the solid target. Heat from the critical surface is conducted down the temperature gradient towards the solid surface, where it generates more plasma, keeping the ablation process going. The cooling process due to the rapid expansion is balanced by laser energy deposition keeping the temperature of the low density corona roughly constant. The region between the ablation and critical surfaces is often referred to as conduction zone.
Fig. 3. Schematic of a typical DAC setup including the diamond anvils, metal gasket, sample and a ruby sphere pressure reference. The figure also includes some examples of different cell/gear box systems used.
Fig. 4. Laser–ion acceleration for isochoric heating: (a) a curved target for focusing of ion beams for isochoric heating to generate WDM as used by Patel et al. [54], (b) a typical deuteron BOA spectrum taken at the Trident laser facility obtained by the iWASP diagnostic[123].
Fig. 5. The VISAR diagnostic: (a) schematic of a Mach–Zehnder interferometer setup in a typical VISAR system[134] with two beamsplitters (BS1 and BS2), mirrors (M1 and M2) and a delay etalon inserted in one interferometer arm, the line-imaged data is recorded by a streak camera; (b) an example of typical VISAR data.
Fig. 6. (a) Schematic of the X-ray Thomson scattering process. XRTS spectra from warm dense deuterium compressed by laser-driven shock obtained by Davis et al. [158]: these measurements were carried out both (b) in collective geometry showing the downshifted-plasmon feature and (c) in noncollective/backscattering geometry with a very clear Compton peak.
Fig. 7. An example of X-ray radiographic measurement on warm dense carbon carried out by Falk et al. [52, 142]. A diamond sample was driven by laser with $5\times 10^{14}~\text{W/cm}^{2}$ intensity. A point projection radiography setup with 30 $\unicode[STIX]{x03BC}$ m pinhole and Vanadium He-$\unicode[STIX]{x03B1}$ backlighter at 5.2 keV were used. (a) An example of the X-ray film used for the radiographic measurement, (b) model of the target layout including the Ni He-$\unicode[STIX]{x03B1}$ backlighter and pinhole used for XRTS measurement as viewed by the radiography film, (c) detail of the radiographic measurement including the CH step wedge used for X-ray intensity calibration, and (d) Abel inversion plot used to extract the density from shock-released diamond.
Fig. 8. Temporally resolved measurement of X-ray absorption near K-edge (XANES) on 100 nm aluminium sample heated by a p-polarized 120 fs laser pulse at 800 nm, 6 J/cm$^{2}$ . Shots taken with different pump–probe relative delay show how the spectra change during the nonthermal melting of the sample transiting through the WDM regime. This data comes from an experiment by Dorchies et al. in Ref. [105].
Fig. 9. A schematic of a X-ray diffraction setup at the Matter at Extreme Conditions (MEC) end-station of the LCLS. A double shock is driven inside a polystyrene sample by a stepped laser drive created by overlapping two laser pulses. The shock conditions are recorded by a line-imaging VISAR diagnostic and the microscopic structure of extreme carbon states are measured using single X-ray pulses with 8.2 keV energy and 50 fs pulse duration recorded by a large area X-ray detector. Diamond signature is detected during the second shock formation[35].

Set citation alerts for the article
Please enter your email address
© Copyright 2018-2021 | Chinese Laser Press. All Rights Reserved 沪ICP备15018463号-20