• Chinese Optics Letters
  • Vol. 16, Issue 1, 013201 (2018)
Xulei Ge1、2、3, Yuan Fang2、3, Su Yang2、3, Wenqing Wei2、3, Feng Liu2、3、*, Peng Yuan2、3, Jingui Ma2、3, Li Zhao1, Xiaohui Yuan2、3、**, and Jie Zhang2、3
Author Affiliations
  • 1State Key Laboratory of Surface Physics and Department of Physics, Fudan University, Shanghai 200433, China
  • 2Key Laboratory for Laser Plasmas (MoE) and School of Physics and Astronomy, Shanghai Jiao Tong University, Shanghai 200240, China
  • 3Collaborative Innovation Center of IFSA (CICIFSA), Shanghai Jiao Tong University, Shanghai 200240, China
  • show less
    DOI: 10.3788/COL201816.013201 Cite this Article Set citation alerts
    Xulei Ge, Yuan Fang, Su Yang, Wenqing Wei, Feng Liu, Peng Yuan, Jingui Ma, Li Zhao, Xiaohui Yuan, Jie Zhang. Characterization and application of plasma mirror for ultra-intense femtosecond lasers[J]. Chinese Optics Letters, 2018, 16(1): 013201 Copy Citation Text show less
    Schematic of the experimental setup. Ag1–Ag4 are silver mirrors, W1–W4 for wedged fused silica.
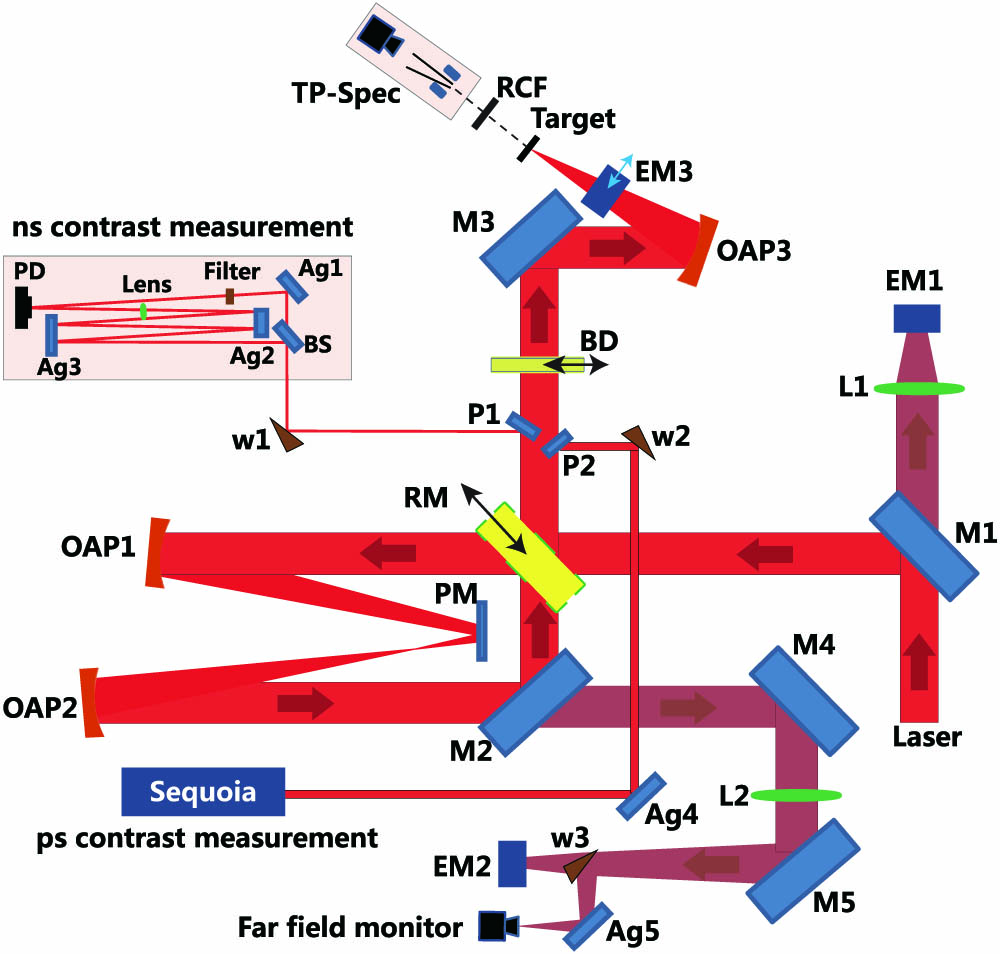
    Fig. 1. Schematic of the experimental setup. Ag1–Ag4 are silver mirrors, W1–W4 for wedged fused silica.
    (Color online) (a) Nanosecond laser contrasts before and after using the PM. The peak at −30 ns is the attenuated main beam from one branch. Another branch of the delayed and focused beam displays that the initial laser pulse has two ultrashort prepulses (in the black curve) at −21 ns and −10 ns. The intensity of prepulses is reduced below the noise when using the PM (in the red curve). (b) Picosecond laser contrasts. Two orders of magnitude improvement is measured for 10 ps prior to the main peak.
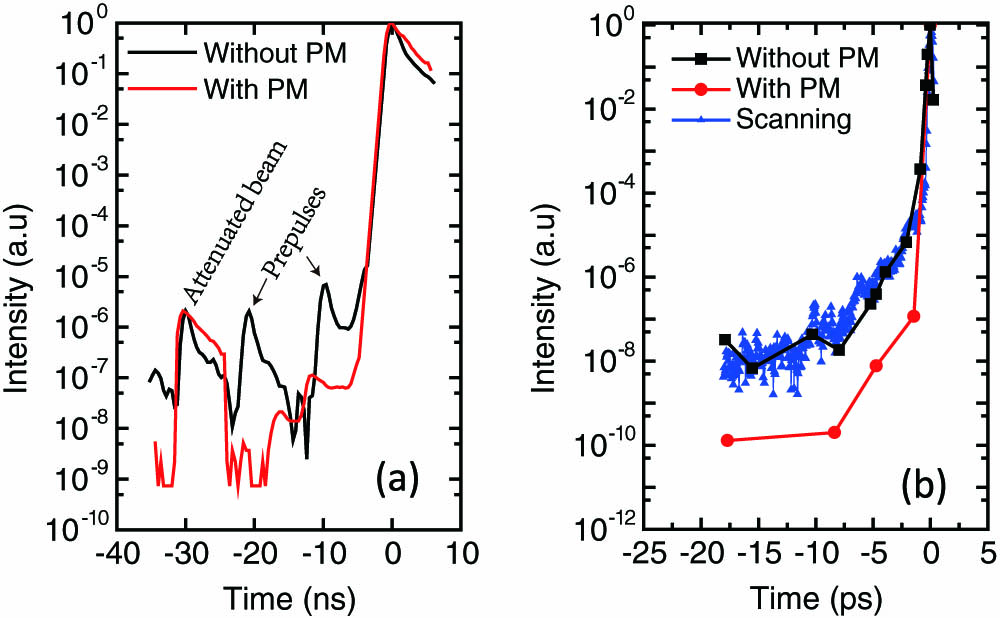
    Fig. 2. (Color online) (a) Nanosecond laser contrasts before and after using the PM. The peak at 30ns is the attenuated main beam from one branch. Another branch of the delayed and focused beam displays that the initial laser pulse has two ultrashort prepulses (in the black curve) at 21ns and 10ns. The intensity of prepulses is reduced below the noise when using the PM (in the red curve). (b) Picosecond laser contrasts. Two orders of magnitude improvement is measured for 10 ps prior to the main peak.
    (Color online) Normalized far-field distribution and lineouts of the reflected pulse, (a) from the Ag-coated surface at low laser energy, avoiding the PM breakdown, (b)–(d) for incoming laser intensities of Ipm=9.5×10¹⁴, 2.3×10¹⁵, and 2.6×10¹⁶ W/cm2, respectively. (e) The percentage of encircled energy over the whole beam with respect to the focal spot radius. (f) The integrated reflectivity and Strehl ratio as a function of laser intensity on PM. The error bars are due to shot-to-shot fluctuation and the dashed line represents the Strehl ratio in the case of (a).
    Fig. 3. (Color online) Normalized far-field distribution and lineouts of the reflected pulse, (a) from the Ag-coated surface at low laser energy, avoiding the PM breakdown, (b)–(d) for incoming laser intensities of Ipm=9.5×10¹⁴, 2.3×10¹⁵, and 2.6×10¹⁶W/cm2, respectively. (e) The percentage of encircled energy over the whole beam with respect to the focal spot radius. (f) The integrated reflectivity and Strehl ratio as a function of laser intensity on PM. The error bars are due to shot-to-shot fluctuation and the dashed line represents the Strehl ratio in the case of (a).
    (Color online) Proton acceleration results from testing the performances of the PM setup. (a) The proton beam spatial-intensity distribution for LC and (b) for HC. (c) The dependence of the maximum proton energies on target thicknesses for aluminium foils in LC (black squares) and carbon foils in HC (red circles) at Ipm=2.3×10¹⁵ W/cm2. (d) Maximum proton energy with respect to the laser intensity on the PM surface. The error bars are all due to shot-to-shot fluctuation.
    Fig. 4. (Color online) Proton acceleration results from testing the performances of the PM setup. (a) The proton beam spatial-intensity distribution for LC and (b) for HC. (c) The dependence of the maximum proton energies on target thicknesses for aluminium foils in LC (black squares) and carbon foils in HC (red circles) at Ipm=2.3×10¹⁵W/cm2. (d) Maximum proton energy with respect to the laser intensity on the PM surface. The error bars are all due to shot-to-shot fluctuation.
    Xulei Ge, Yuan Fang, Su Yang, Wenqing Wei, Feng Liu, Peng Yuan, Jingui Ma, Li Zhao, Xiaohui Yuan, Jie Zhang. Characterization and application of plasma mirror for ultra-intense femtosecond lasers[J]. Chinese Optics Letters, 2018, 16(1): 013201
    Download Citation