• Spectroscopy and Spectral Analysis
  • Vol. 41, Issue 11, 3456 (2021)
Fan YU1、1;, He-ping LI1、1;, Tian-yu ZHAO1、1;, Zhuo-wen LIANG2、2;, Hang ZHAO1、1;, and Shuang WANG1、1; *;
Author Affiliations
  • 11. Institute of Photonics and Photon-Technology, Northwest University, Xi’an 710069, China
  • 22. Department of Orthopaedics, Xijing Hospital, Air Force Military Medical University, Xi’an 710032, China
  • show less
    DOI: 10.3964/j.issn.1000-0593(2021)11-3456-06 Cite this Article
    Fan YU, He-ping LI, Tian-yu ZHAO, Zhuo-wen LIANG, Hang ZHAO, Shuang WANG. Deep-Surface Analysis of Multi-Layered Turbid Samples Using Inverse Spatially Offset Raman Spectroscopy[J]. Spectroscopy and Spectral Analysis, 2021, 41(11): 3456 Copy Citation Text show less
    (a) Schematic diagram of the modular inverse spatially offset Raman spectroscopy (SORS); (b) Schematic diagram of the principle of forming a ring-shaped laser beam of the adjustable radius with the axicon
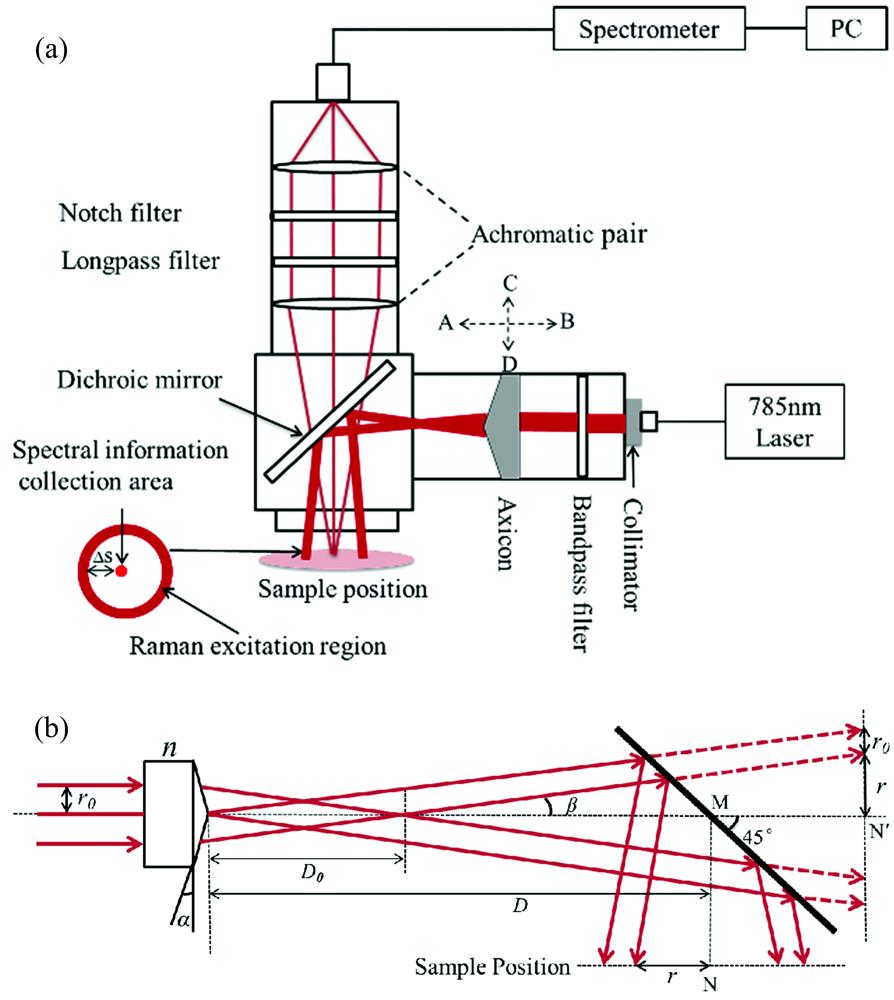
    Fig. 1. (a) Schematic diagram of the modular inverse spatially offset Raman spectroscopy (SORS); (b) Schematic diagram of the principle of forming a ring-shaped laser beam of the adjustable radius with the axicon
    (a) Pictures of sheep scapula with 3 and 4 mm thickness. The mixed Raman spectra obtained from the two-layer biological tissue model of sheep scapula thickness d=3 mm (b) and (c) d=4 mm under different spatial offsets. The Raman spectra of sheep scapula and paracetamol were measured separately and listed at the top and bottom for reference; (d) The relative Raman intensity ratio corresponding to paracetamol (1 326 cm-1) and sheep scapula (960 cm-1) as a function of the offset value
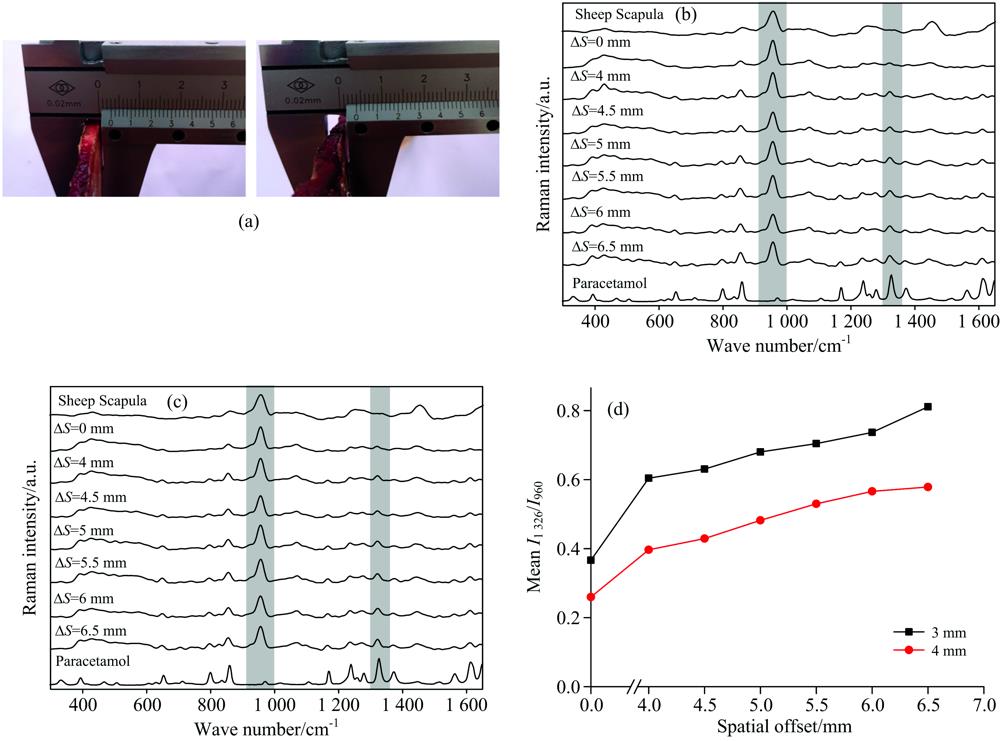
    Fig. 2. (a) Pictures of sheep scapula with 3 and 4 mm thickness. The mixed Raman spectra obtained from the two-layer biological tissue model of sheep scapula thickness d=3 mm (b) and (c) d=4 mm under different spatial offsets. The Raman spectra of sheep scapula and paracetamol were measured separately and listed at the top and bottom for reference; (d) The relative Raman intensity ratio corresponding to paracetamol (1 326 cm-1) and sheep scapula (960 cm-1) as a function of the offset value
    (a) Schematic diagram of three-layer model; (b) The Raman spectra of the pig skin, silicone rubber, and paracetamol are shown for reference;(c) A set of SORS spectra measured with the three-layer model of silicone rubber of 3 mm (c) and 6 mm (d) under different spatial offset values
    Fig. 3. (a) Schematic diagram of three-layer model; (b) The Raman spectra of the pig skin, silicone rubber, and paracetamol are shown for reference;(c) A set of SORS spectra measured with the three-layer model of silicone rubber of 3 mm (c) and 6 mm (d) under different spatial offset values
    (a) The relative Raman intensity ratio corresponding to silicone rubber (490 cm-1) and pig skin (1 450 cm-1) as a function of the offset value; (b) The relative Raman intensity ratio corresponding to paracetamol (1 326 cm-1) and pig skin (1 450 cm-1) as a function of the offset value. The thickness of silicone rubber is 3 and 6 mm
    Fig. 4. (a) The relative Raman intensity ratio corresponding to silicone rubber (490 cm-1) and pig skin (1 450 cm-1) as a function of the offset value; (b) The relative Raman intensity ratio corresponding to paracetamol (1 326 cm-1) and pig skin (1 450 cm-1) as a function of the offset value. The thickness of silicone rubber is 3 and 6 mm
    Fan YU, He-ping LI, Tian-yu ZHAO, Zhuo-wen LIANG, Hang ZHAO, Shuang WANG. Deep-Surface Analysis of Multi-Layered Turbid Samples Using Inverse Spatially Offset Raman Spectroscopy[J]. Spectroscopy and Spectral Analysis, 2021, 41(11): 3456
    Download Citation