
Jing-xin ZOU, Yan-qin LIU, Ming-zhe YUAN, Qi-hang WANG, Zhou FAN, Fu WAN. Study on the Raman Spectral Characteristics in Ageing Condition Discrimination of Oil-Paper Insulation[J]. Spectroscopy and Spectral Analysis, 2021, 41(10): 3159
- Spectroscopy and Spectral Analysis
- Vol. 41, Issue 10, 3159 (2021)
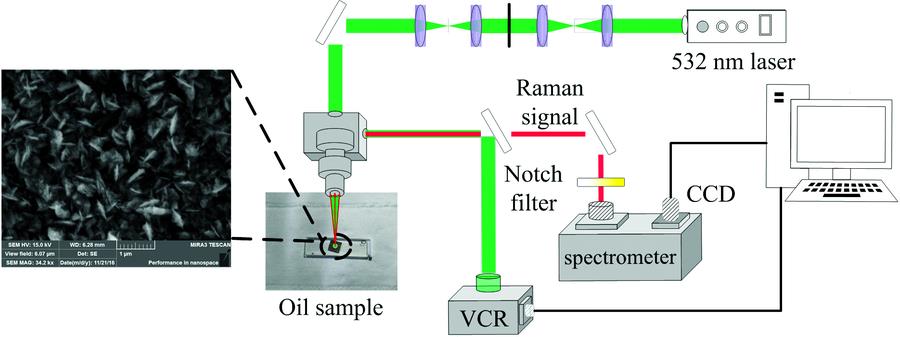
Fig. 1. Schematic diagram of the SERS detection test platform
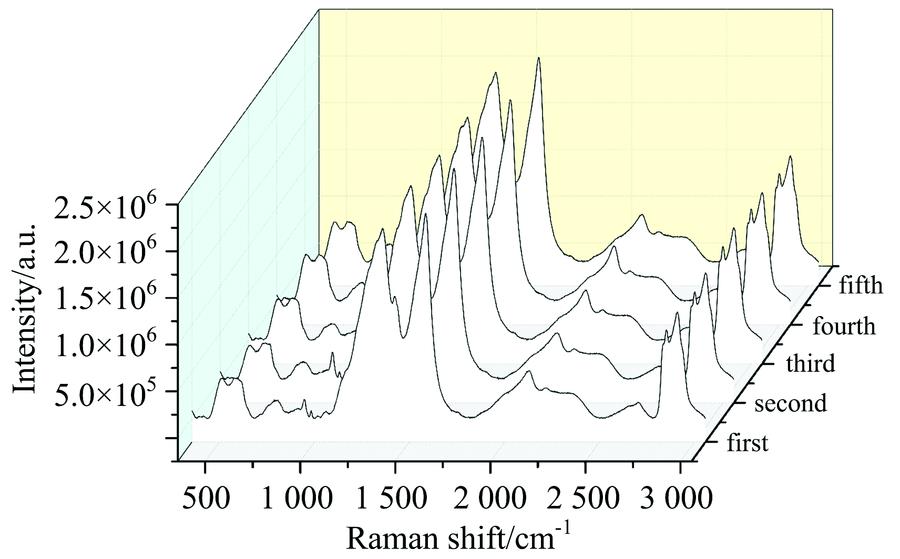
Fig. 2. The result of Preprocessing for Raman signal data
Fig. 3. Key variables selection by CARS
(a): Variation trend of variable; (b): Variation trend of RMSECV in cross-validation; (c): Regression coefficient path
(a): Variation trend of variable; (b): Variation trend of RMSECV in cross-validation; (c): Regression coefficient path
Fig. 4. Best variables selected by CARS
Fig. 5. The Voigt resolution of Raman spectra
Fig. 6. The result of Voigt analysis
(a): Peak area; (b): Peak width at half height; (c): Gaussian coefficient; (d): Lorentzian coefficient
(a): Peak area; (b): Peak width at half height; (c): Gaussian coefficient; (d): Lorentzian coefficient
Fig. 7. Classification result of oil-paper samples
Fig. 8. Cumulative variance of the first eight principal components
Fig. 9. Loading plot for PC1 and the average value of the principle component for each sample
Fig. 10. Scatter plots of the PC scores for four classes of oil samples, with the PC scores derived from the Raman spectra
Fig. 11. Relationship between ageing time and WPEE of Raman spectra

Set citation alerts for the article
Please enter your email address
© Copyright 2018-2021 | Chinese Laser Press. All Rights Reserved 沪ICP备15018463号-20