• Acta Optica Sinica
  • Vol. 39, Issue 10, 1006005 (2019)
Chen Wang1, Qingwen Liu1、*, Dian Chen1, He Li1, Wenbo Liang2, and Zuyuan He1
Author Affiliations
  • 1State Key Laboratory of Advanced Optical Communication Systems and Networks, Department of Electrical Engineering, Shanghai Jiao Tong University, Shanghai 200240, China
  • 2Puniu (Shanghai) Technology Co. Ltd., Shanghai 200240, China
  • show less
    DOI: 10.3788/AOS201939.1006005 Cite this Article Set citation alerts
    Chen Wang, Qingwen Liu, Dian Chen, He Li, Wenbo Liang, Zuyuan He. Monitoring Pipeline Leakage Using Fiber-Optic Distributed Acoustic Sensor[J]. Acta Optica Sinica, 2019, 39(10): 1006005 Copy Citation Text show less
    Schematic of HiFi-DAS system
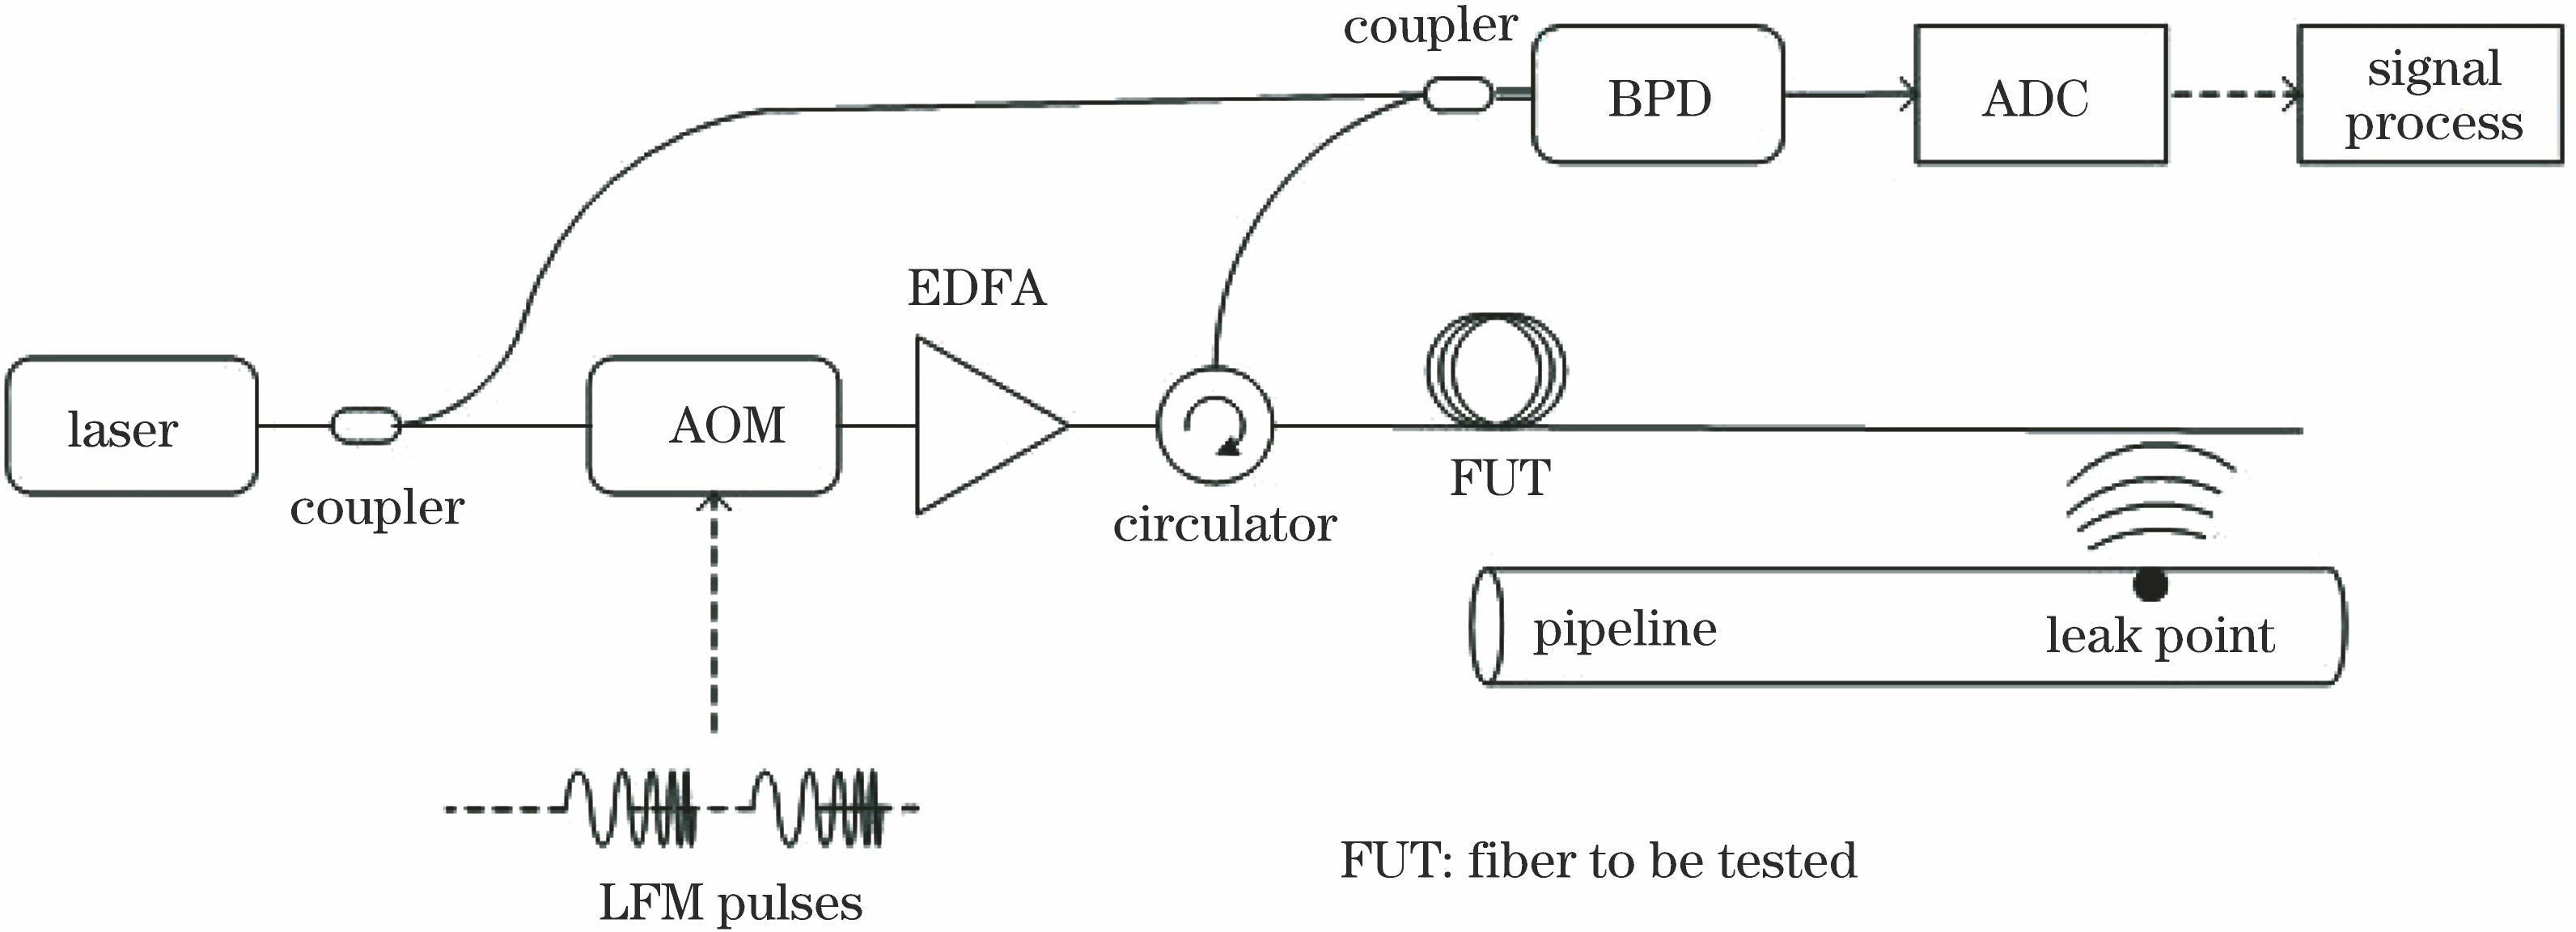
    Fig. 1. Schematic of HiFi-DAS system
    Front and side views of pipeline and optical cable. (a) Front view; (b) side view
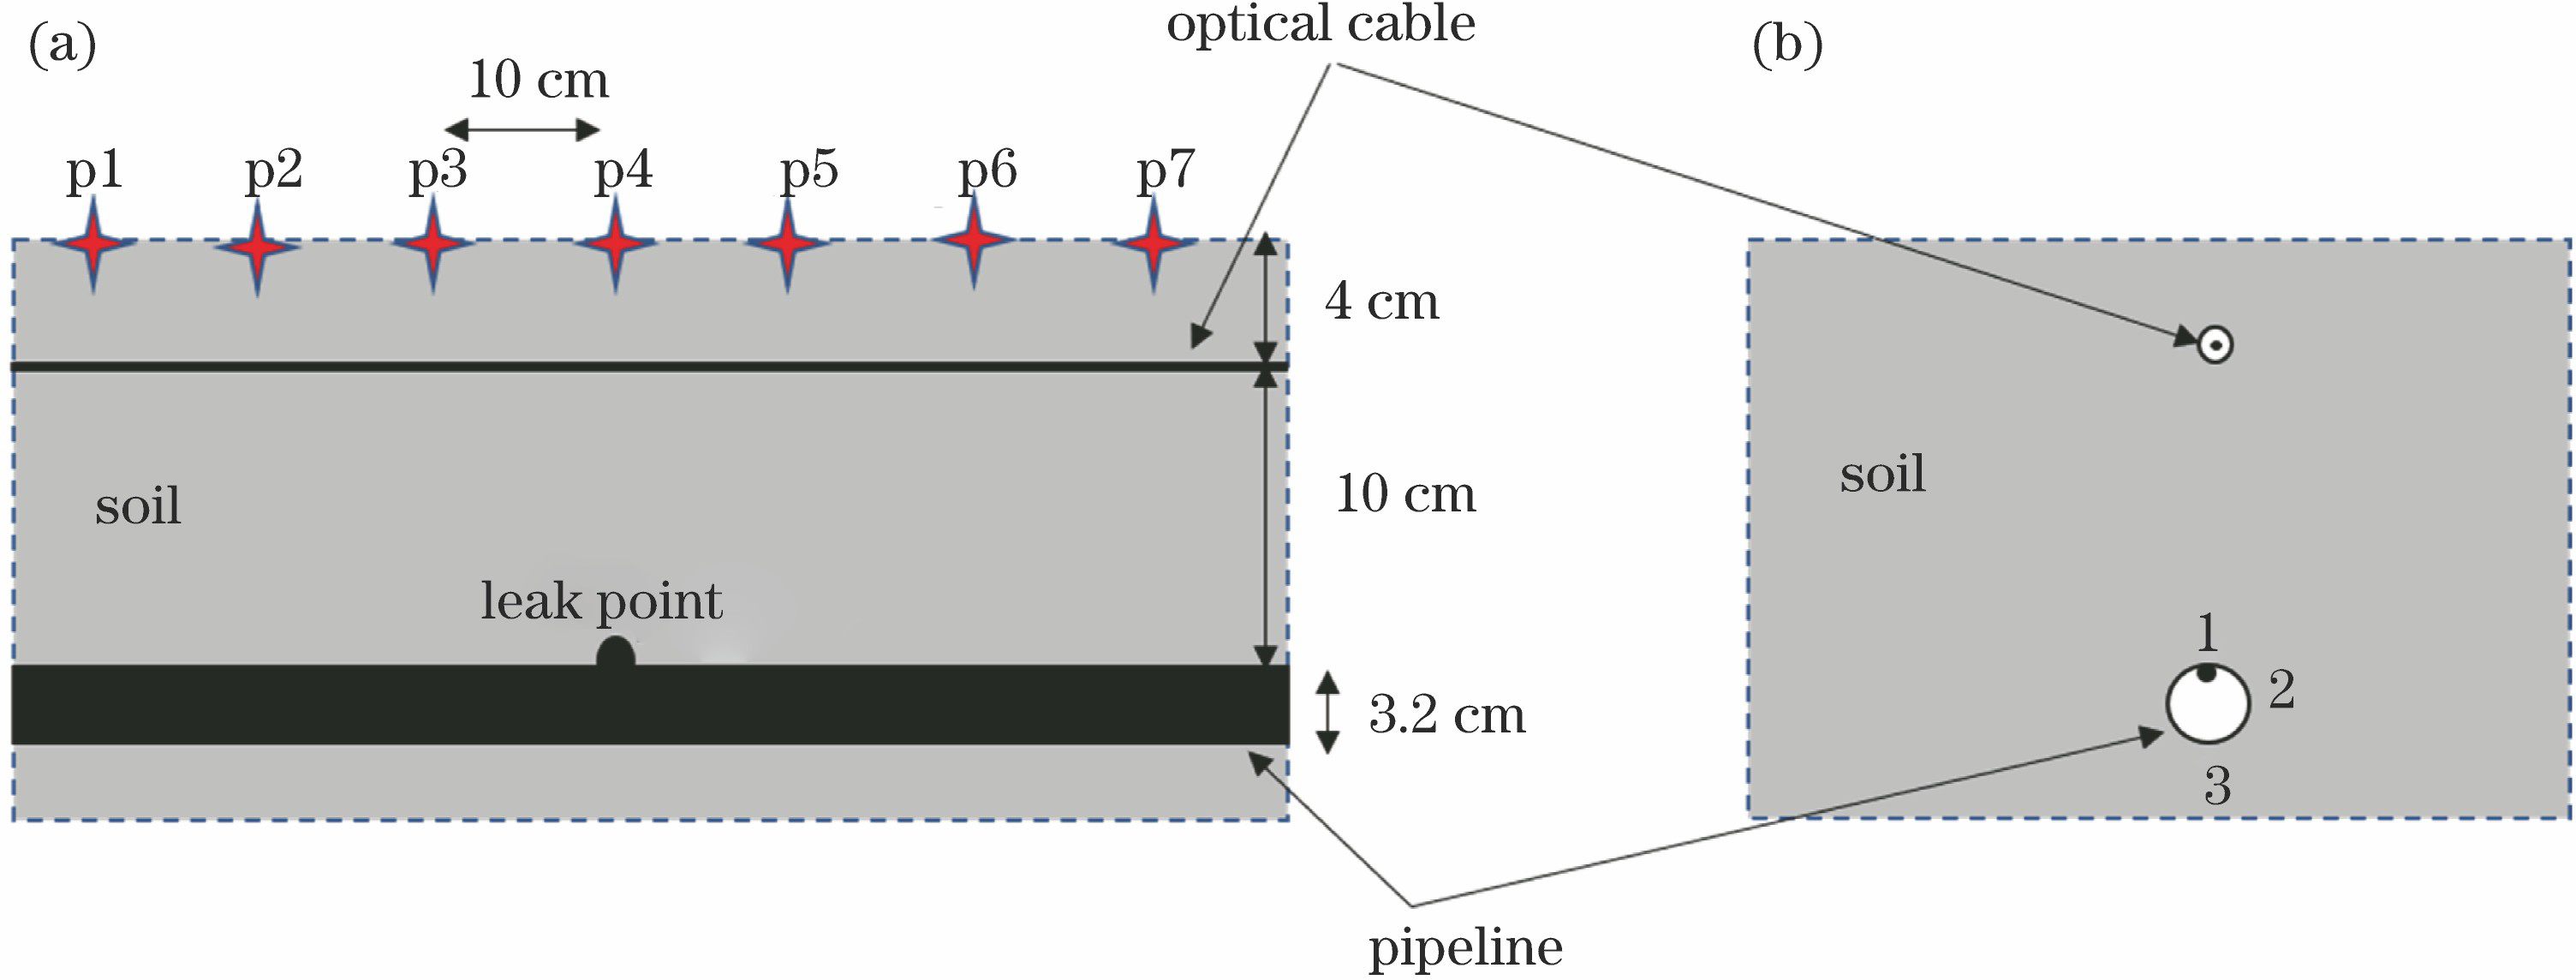
    Fig. 2. Front and side views of pipeline and optical cable. (a) Front view; (b) side view
    Amplitude of leakage signal at each location
    Fig. 3. Amplitude of leakage signal at each location
    2560 differential phase traces demodulated under 0.2 MPa gas pressure
    Fig. 4. 2560 differential phase traces demodulated under 0.2 MPa gas pressure
    Standard deviation curves at the end of fiber under different conditions. (a) No leakage; (b) 0.2 MPa gas pressure
    Fig. 5. Standard deviation curves at the end of fiber under different conditions. (a) No leakage; (b) 0.2 MPa gas pressure
    Standard deviation curves of leaking holes at different positions. (a) Position 1; (b) position 2; (c) position 3
    Fig. 6. Standard deviation curves of leaking holes at different positions. (a) Position 1; (b) position 2; (c) position 3
    2560 differential phase traces demodulated under 0.05 MPa gas pressure
    Fig. 7. 2560 differential phase traces demodulated under 0.05 MPa gas pressure
    Noise statistics. (a) Power spectrum; (b) amplitude distribution
    Fig. 8. Noise statistics. (a) Power spectrum; (b) amplitude distribution
    Differential phase trace and standard deviation curve at the end of fiber after wavelet denoising under gas pressure of 0.05 MPa. (a) Differential phase trace; (b) standard deviation at the end of fiber
    Fig. 9. Differential phase trace and standard deviation curve at the end of fiber after wavelet denoising under gas pressure of 0.05 MPa. (a) Differential phase trace; (b) standard deviation at the end of fiber
    Chen Wang, Qingwen Liu, Dian Chen, He Li, Wenbo Liang, Zuyuan He. Monitoring Pipeline Leakage Using Fiber-Optic Distributed Acoustic Sensor[J]. Acta Optica Sinica, 2019, 39(10): 1006005
    Download Citation