• Infrared and Laser Engineering
  • Vol. 50, Issue 12, 20210711 (2021)
Yingtao Liu1、2、3、4, Lulu Xu5, Fangcheng He1、2、3、4, Shuoning Li1、2、3、4, and Danggang Yang1、2、3、4
Author Affiliations
  • 1AECC Beijing Institute of Aeronautical Materials, Beijing 100095, China
  • 2Beijing Key Laboratory of Aeronautical Materials Testing and Evaluation, Beijing 100095, China
  • 3Key Laboratory of Aeronautical Materials Testing and Evaluation, Aero Engine Corporation of China, Beijing 100095, China
  • 4Aviation Key Laboratory of Science and Technology on Materials Testing and Evaluation, Beijing 100095, China
  • 5School of Materials Science and Engineering, Beihang University, Beijing 100191, China
  • show less
    DOI: 10.3788/IRLA20210711 Cite this Article
    Yingtao Liu, Lulu Xu, Fangcheng He, Shuoning Li, Danggang Yang. Effects of environmental factors on infrared flash thermography nondestructive testing in outfield detection[J]. Infrared and Laser Engineering, 2021, 50(12): 20210711 Copy Citation Text show less
    3D cylindrical model
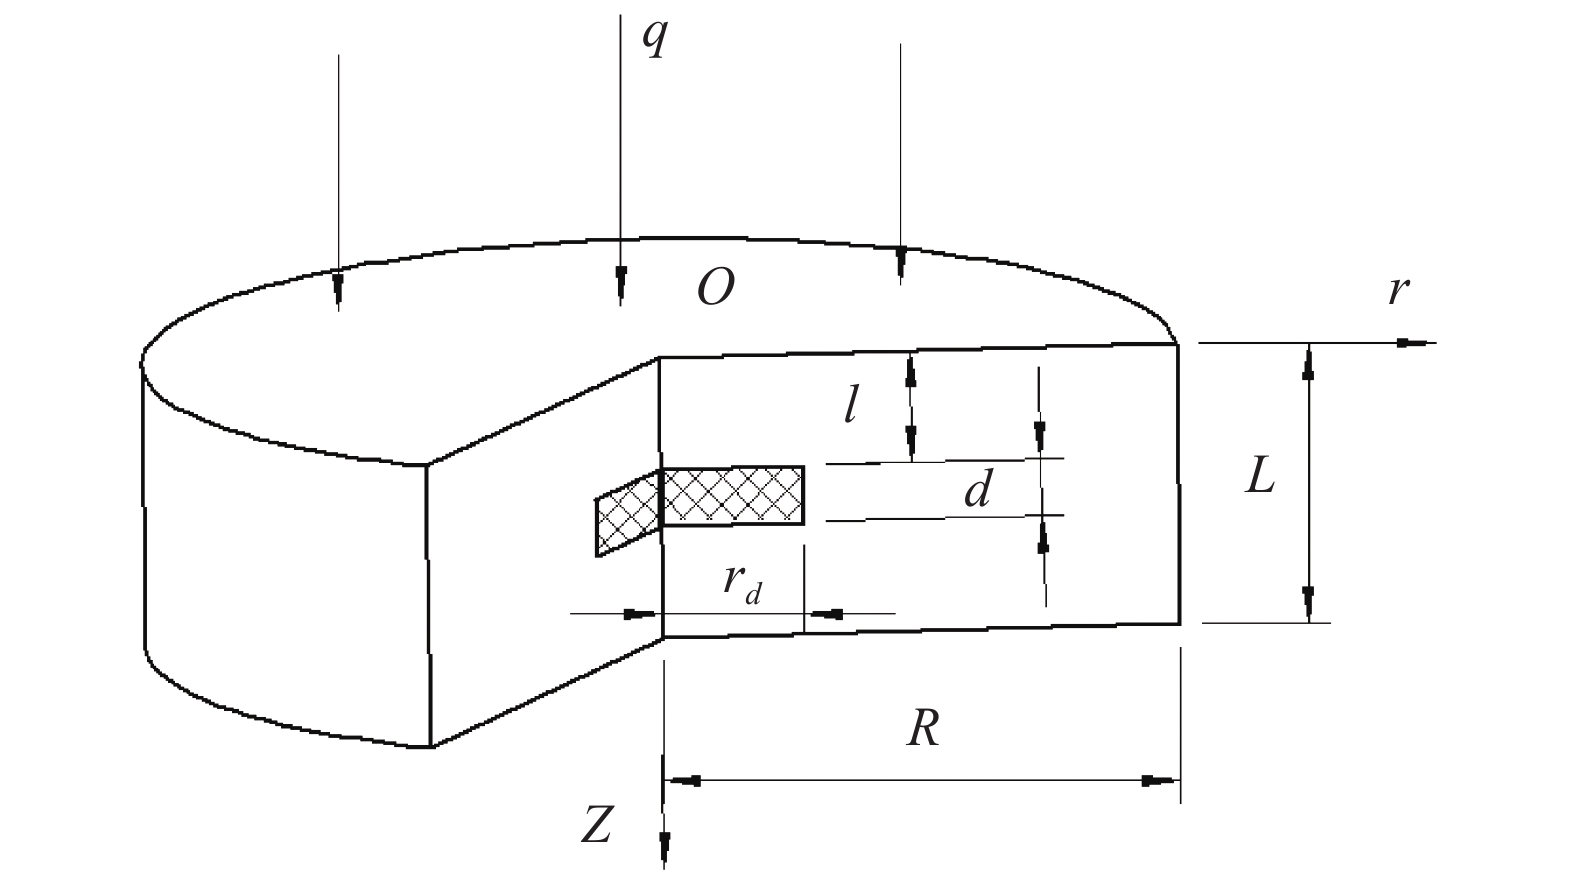
    Fig. 1. 3D cylindrical model
    2D model simplified from 3D cylindrical model
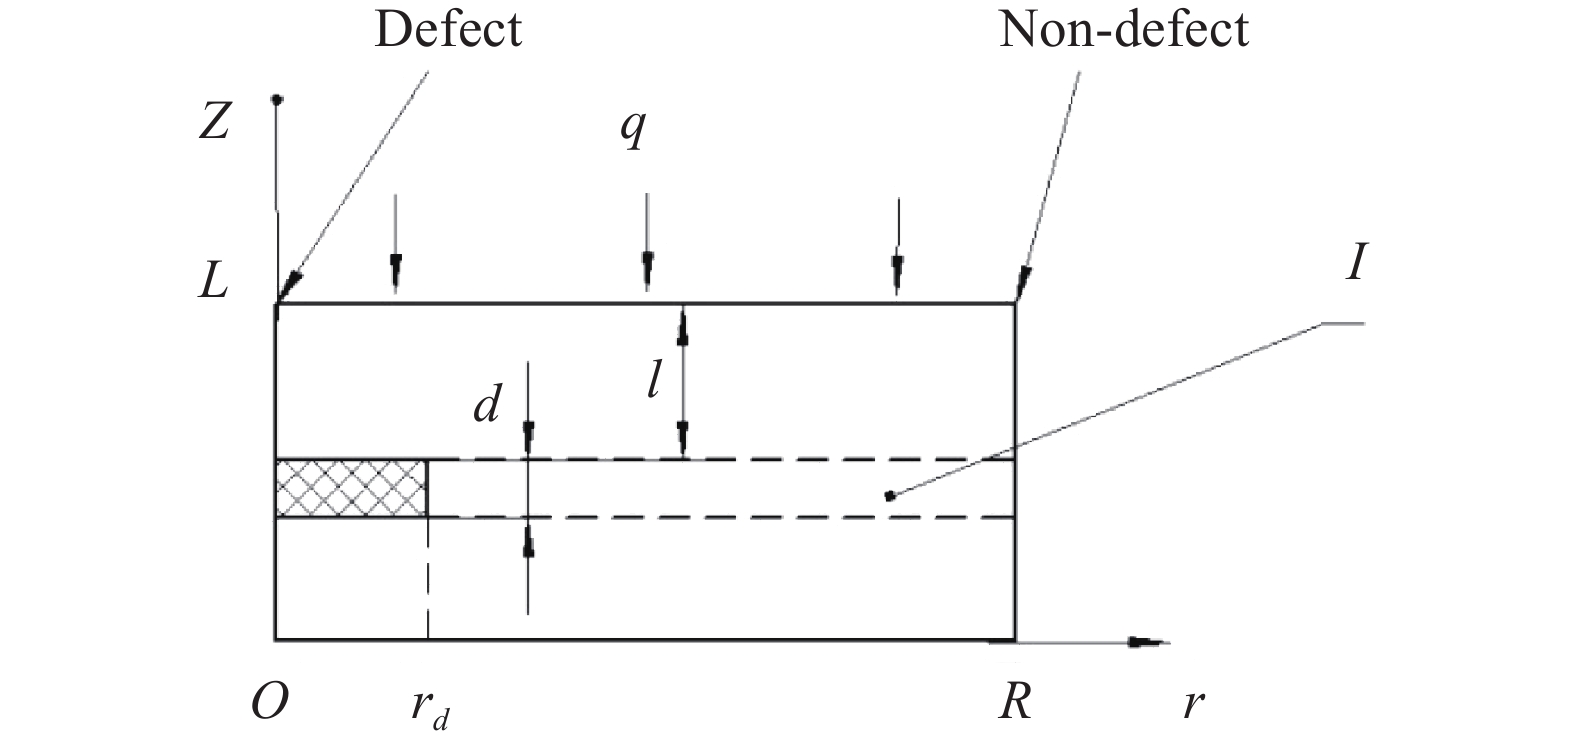
    Fig. 2. 2D model simplified from 3D cylindrical model
    Arrangement of defects in the specimen
    Fig. 3. Arrangement of defects in the specimen
    Simulation result of temperature difference ΔT(t) in different testing ambient temperature
    Fig. 4. Simulation result of temperature difference ΔT(t) in different testing ambient temperature
    Simulation result of temperature contrast C(t) in different testing ambient temperature
    Fig. 5. Simulation result of temperature contrast C(t) in different testing ambient temperature
    Positions of defect point and reference non-defect point in thermal image
    Fig. 6. Positions of defect point and reference non-defect point in thermal image
    Experiment result of temperature difference ΔT(t) in different testing ambient temperature
    Fig. 7. Experiment result of temperature difference ΔT(t) in different testing ambient temperature
    Experiment result of temperature contrast C(t) in different testing ambient temperature
    Fig. 8. Experiment result of temperature contrast C(t) in different testing ambient temperature
    2D model of uneven sunshine
    Fig. 9. 2D model of uneven sunshine
    Simulation result of temperature difference ΔT(t) in uneven sunshine and in homogeneous temperature
    Fig. 10. Simulation result of temperature difference ΔT(t) in uneven sunshine and in homogeneous temperature
    Simulation result of temperature contrast C(t) in uneven sunshine and in homogeneous temperature
    Fig. 11. Simulation result of temperature contrast C(t) in uneven sunshine and in homogeneous temperature
    Thermal image t =1.102 s of the specimen in uneven sunshine before experiment
    Fig. 12. Thermal image t =1.102 s of the specimen in uneven sunshine before experiment
    Experiment result of temperature difference ΔT(t) in uneven sunshine and in homogeneous temperature
    Fig. 13. Experiment result of temperature difference ΔT(t) in uneven sunshine and in homogeneous temperature
    Experiment result of temperature contrast C(t) in uneven sunshine and in homogeneous temperature
    Fig. 14. Experiment result of temperature contrast C(t) in uneven sunshine and in homogeneous temperature
    Simulation result of temperature difference ΔT(t) in different wind velocity
    Fig. 15. Simulation result of temperature difference ΔT(t) in different wind velocity
    Simulation result of temperature contrast C(t) in different wind velocity
    Fig. 16. Simulation result of temperature contrast C(t) in different wind velocity
    Experiment result of temperature difference ΔT(t) in different wind velocity
    Fig. 17. Experiment result of temperature difference ΔT(t) in different wind velocity
    Experiment result of temperature contrast C(t) in different wind velocity
    Fig. 18. Experiment result of temperature contrast C(t) in different wind velocity
    Specimen thickness L/m Defect thickness d/m Defect depth l/m Specimen radius R/m Defect radius rd/m Heating pulse duration t/s Heating flux density q/W·m−2
    0.00250.000050.00050.0200.00750.0020.84×107
    Table 1. Main parameter in the model
    MaterialDensity ρ/kg·m−3Specific heat cp/kJ·kg−1·K−1Thermal conductivity λ/W·m−1·K−1
    GFRP[11]19001.20.3
    Air(20℃)[12]1.2051.0050.0259
    Air(30℃)[12]1.1651.0050.0267
    Table 2. Thermal properties of materials
    Yingtao Liu, Lulu Xu, Fangcheng He, Shuoning Li, Danggang Yang. Effects of environmental factors on infrared flash thermography nondestructive testing in outfield detection[J]. Infrared and Laser Engineering, 2021, 50(12): 20210711
    Download Citation