• Advanced Photonics
  • Vol. 6, Issue 1, 016004 (2024)
Ling-Dong Kong1、2、†,*, Tian-Zhu Zhang1、2, Xiao-Yu Liu1、2, Hao Li1、2, Zhen Wang1、2, Xiao-Ming Xie1、2, and Li-Xing You1、2、3、*
Author Affiliations
  • 1Chinese Academy of Sciences (CAS), Shanghai Institute of Microsystem and Information Technology, National Key Laboratory of Materials for Integrated Circuits, Shanghai, China
  • 2CAS Center for Excellence in Superconducting Electronics, Shanghai, China
  • 3University of Chinese Academy of Sciences, Center of Materials Science and Optoelectronics Engineering, Beijing, China
  • show less
    DOI: 10.1117/1.AP.6.1.016004 Cite this Article Set citation alerts
    Ling-Dong Kong, Tian-Zhu Zhang, Xiao-Yu Liu, Hao Li, Zhen Wang, Xiao-Ming Xie, Li-Xing You. Large-inductance superconducting microstrip photon detector enabling 10 photon-number resolution[J]. Advanced Photonics, 2024, 6(1): 016004 Copy Citation Text show less
    SMSPD. (a) Scanning electron micrograph of the SMSPD. (b) Simulated current density distribution in three sections: detecting (A), connecting (B), and bending (C). Points a–e indicate the relative current density. This structure ensures a higher current density in the detecting section than in the other sections. (c) Rising section of typical output waveforms generated from different detections of one, two, and three photons.
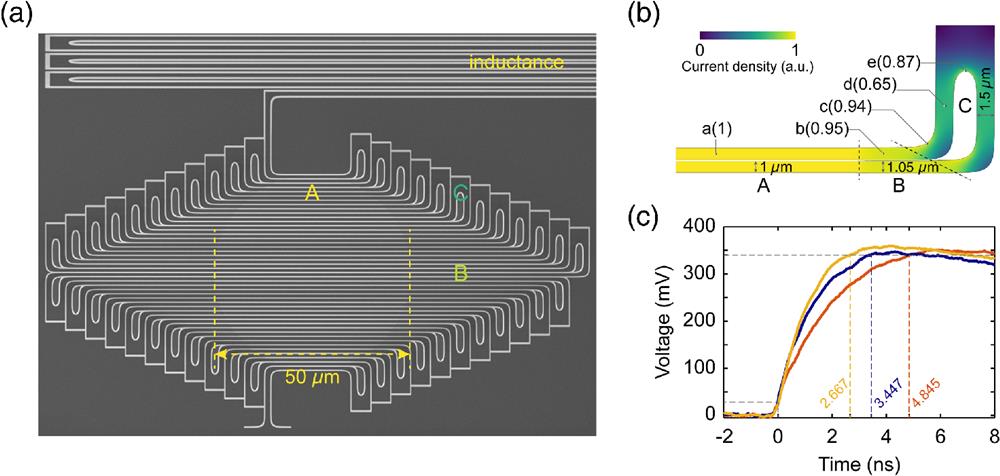
    Fig. 1. SMSPD. (a) Scanning electron micrograph of the SMSPD. (b) Simulated current density distribution in three sections: detecting (A), connecting (B), and bending (C). Points a–e indicate the relative current density. This structure ensures a higher current density in the detecting section than in the other sections. (c) Rising section of typical output waveforms generated from different detections of one, two, and three photons.
    Photon-number resolution in an SMSPD. (a) Histograms (dots) and Gaussian fitting (lines) of the rising-edge time of response pulses under pulsed laser illumination with an effective mean photon number μ˜ at 2.5 and 5.1. Color areas represent the decomposed Gaussian functions. (b) Confusion matrix illustrating the probabilities of assigning n detected photons to m reported photons, where the diagonal terms Pnn represent the photon-number readout fidelity. (c) Photon count statistics reconstructed from the distributions of pulse rising-edge time at different effective mean photon numbers μ˜ ranging from 0.05 to 5. The measured photon count statistics (color bars) align closely with the Poisson statistics of the coherent source (dashed lines).
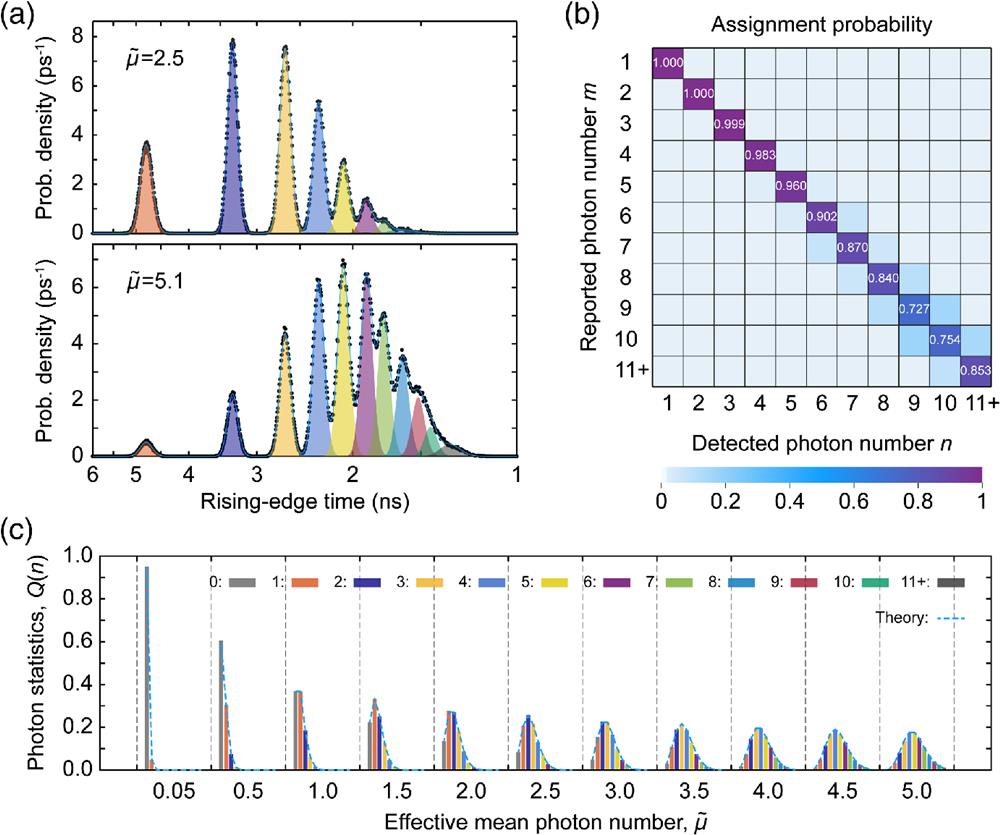
    Fig. 2. Photon-number resolution in an SMSPD. (a) Histograms (dots) and Gaussian fitting (lines) of the rising-edge time of response pulses under pulsed laser illumination with an effective mean photon number μ˜ at 2.5 and 5.1. Color areas represent the decomposed Gaussian functions. (b) Confusion matrix illustrating the probabilities of assigning n detected photons to m reported photons, where the diagonal terms Pnn represent the photon-number readout fidelity. (c) Photon count statistics reconstructed from the distributions of pulse rising-edge time at different effective mean photon numbers μ˜ ranging from 0.05 to 5. The measured photon count statistics (color bars) align closely with the Poisson statistics of the coherent source (dashed lines).
    Photon-number readout capability versus inductance and width. (a)–(e) Histograms and Gaussian fitting of the rising-edge time of response pulses generated from detectors with varying inductance and width. Black dots, measurement data; blue lines, Gaussian fitting results; color areas, decomposed Gaussian functions. The rising-edge time shows a power function with an exponent of 0.5 in relation to the photon number. Green diamonds, extracted mean of rising-edge time; orange dashed lines, fitted power functions. (f) The τm¯ and τstd‾ of rising-edge time and relative SNR at different detector conditions. (g) Photon-number readout fidelity of detectors with different inductance and width, which are extracted from (a)–(e).
    Fig. 3. Photon-number readout capability versus inductance and width. (a)–(e) Histograms and Gaussian fitting of the rising-edge time of response pulses generated from detectors with varying inductance and width. Black dots, measurement data; blue lines, Gaussian fitting results; color areas, decomposed Gaussian functions. The rising-edge time shows a power function with an exponent of 0.5 in relation to the photon number. Green diamonds, extracted mean of rising-edge time; orange dashed lines, fitted power functions. (f) The τm¯ and τstd of rising-edge time and relative SNR at different detector conditions. (g) Photon-number readout fidelity of detectors with different inductance and width, which are extracted from (a)–(e).
    Real-time readout and binning error reduction. (a) Equivalent circuit diagram of the setup. The response pulse through the power splitter is divided into two equal pulses, which then enter two TDCs. One TDC measures the high-level (VH) time stamp tH, while the other TDC measures the low-level (VL) time stamp tL. (b) Histograms and Gaussian fitting of the rising-edge time of response pulses measured by an oscilloscope without a splitter or the 2-TDC setup (all data and 1σ data). (c) The στ of rising-edge time for two readout setups. The results using the 2-TDC setup are slightly inferior to those obtained using an oscilloscope, which is due to the additional timing jitter of the TDCs. (d) The photon-number binning error for three readout methods including oscilloscope, 2-TDC (all data), and 2-TDC (1σ data).
    Fig. 4. Real-time readout and binning error reduction. (a) Equivalent circuit diagram of the setup. The response pulse through the power splitter is divided into two equal pulses, which then enter two TDCs. One TDC measures the high-level (VH) time stamp tH, while the other TDC measures the low-level (VL) time stamp tL. (b) Histograms and Gaussian fitting of the rising-edge time of response pulses measured by an oscilloscope without a splitter or the 2-TDC setup (all data and 1σ data). (c) The στ of rising-edge time for two readout setups. The results using the 2-TDC setup are slightly inferior to those obtained using an oscilloscope, which is due to the additional timing jitter of the TDCs. (d) The photon-number binning error for three readout methods including oscilloscope, 2-TDC (all data), and 2-TDC (1σ data).
    Generation and testing of quantum random numbers. (a) Operating principle of the QRNG. The graph on the right shows a sequence consisting of 50 rising-edge times, along with the random numbers at an effective mean photon number per pulse μ˜ of 5.1. (b) Results of the NIST randomness tests on 1000×106 binary bit strings. The confidence interval, represented by the dashed blue lines, ranges from 0.98 to 1. It is calculated using a normal distribution as an approximation to the binomial distribution.
    Fig. 5. Generation and testing of quantum random numbers. (a) Operating principle of the QRNG. The graph on the right shows a sequence consisting of 50 rising-edge times, along with the random numbers at an effective mean photon number per pulse μ˜ of 5.1. (b) Results of the NIST randomness tests on 1000×106 binary bit strings. The confidence interval, represented by the dashed blue lines, ranges from 0.98 to 1. It is calculated using a normal distribution as an approximation to the binomial distribution.
    Ling-Dong Kong, Tian-Zhu Zhang, Xiao-Yu Liu, Hao Li, Zhen Wang, Xiao-Ming Xie, Li-Xing You. Large-inductance superconducting microstrip photon detector enabling 10 photon-number resolution[J]. Advanced Photonics, 2024, 6(1): 016004
    Download Citation