
Ling-ling ZHA, Wei WANG, Yu XIE, Chang-gong SHAN, Xiang-yu ZENG, You-wen SUN, Hao YIN, Qi-hou HU. Observation of Variations of Ambient CO2 Using Portable FTIR Spectrometer[J]. Spectroscopy and Spectral Analysis, 2022, 42(4): 1036
- Spectroscopy and Spectral Analysis
- Vol. 42, Issue 4, 1036 (2022)
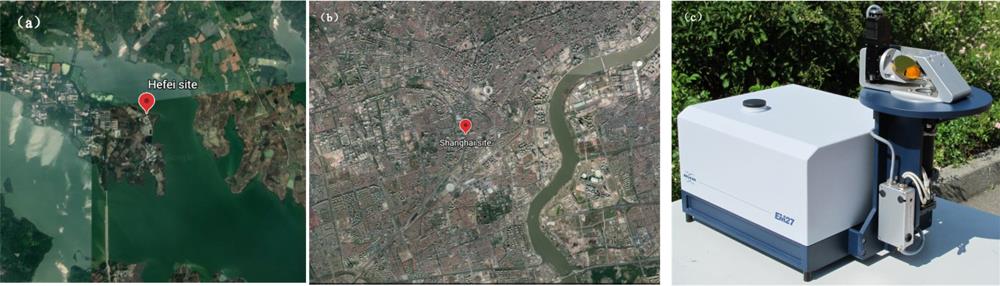
Fig. 1. (a) Observing site (Science Island in the western suburb of Hefei); (b) Observing site (Environmental monitoring center of Shanghai); (c) FTIR spectrometer
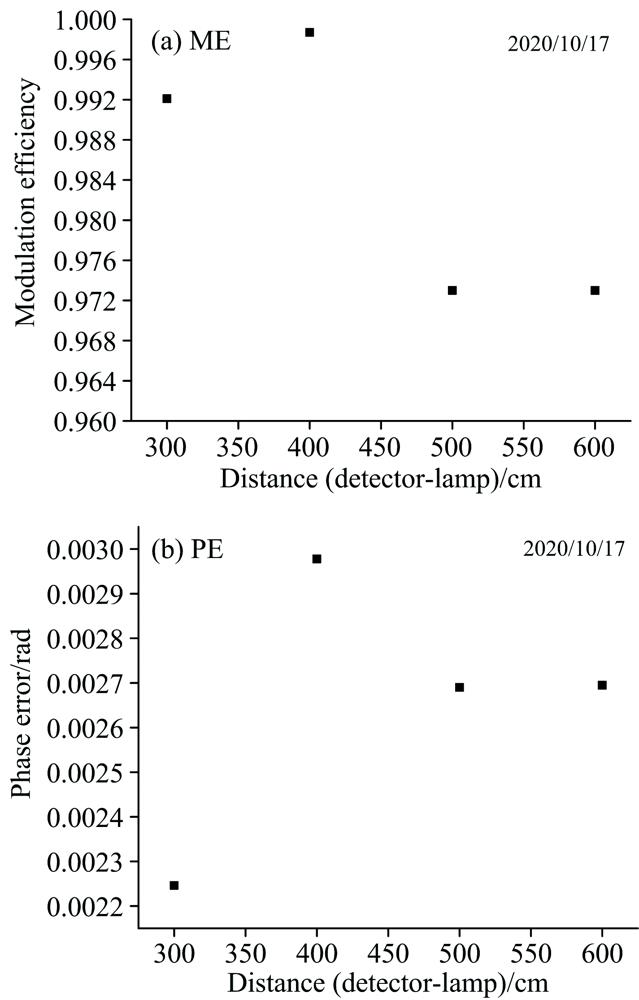
Fig. 2. Amplitude modulation efficiency and phrase error of the spectrometer
Fig. 3. Typical spectral fitting and residuals of CO2 in two spectral windows near (a) 6 220 cm-1, (b) 6 339.5 cm-1
Fig. 4. Time series of retrieved Xair
Fig. 5. The time series of XCO2 observed in Hefei
The light blue circles represent individual measurements; the red circles represent daily average XCO2; the dark blue lines with blue triangles represent monthly average XCO2
The light blue circles represent individual measurements; the red circles represent daily average XCO2; the dark blue lines with blue triangles represent monthly average XCO2
Fig. 6. XCO2 observed by portable FTIR and high-resolution FTIR spectrometer in 2017
Fig. 7. Daily average of XCO2 measured by portable FTIR spectrometer plotted against the corresponding values of the high-resolution FTIR spectrometer
The line shows the best fit to the ratio of the two values
The line shows the best fit to the ratio of the two values
Fig. 8. XCO2 observed by GOSAT and portable FTIR spectrometer
Blue circles are GOSAT data and orange triangle are FTIR data
Blue circles are GOSAT data and orange triangle are FTIR data
Fig. 9. Scatter plot of XCO2 observed by GOSAT and portable FTIR spectrometer
Fig. 10. The time series of XCO2 observed in Hefei and Shanghai
The black and red circles indicate the data observed in Hefei and Shanghai, respectively
The black and red circles indicate the data observed in Hefei and Shanghai, respectively
|
Table 1. ME and PE values
|
Table 2. Spectral windows for retrieval of CO2 column


Set citation alerts for the article
Please enter your email address

© Copyright 2018-2021 | Chinese Laser Press. All Rights Reserved 沪ICP备15018463号-20