• Photonics Research
  • Vol. 11, Issue 10, 1733 (2023)
Yuqi Zhang1, Qiang Luo1, Dahuai Zheng1,3, Shuolin Wang2..., Shiguo Liu1, Hongde Liu1,*, Fang Bo1,4, Yongfa Kong1,5 and Jingjun Xu1,6|Show fewer author(s)
Author Affiliations
  • 1MOE Key Laboratory of Weak-Light Nonlinear Photonics, TEDA Institute of Applied Physics and School of Physics, Nankai University, Tianjin 300457, China
  • 2School of Science, Jiangsu University of Science and Technology, Zhenjiang 212100, China
  • 3e-mail: dhzheng@nankai.edu.cn
  • 4e-mail: bofang@nankai.edu.cn
  • 5e-mail: kongyf@nankai.edu.cn
  • 6e-mail: jjxu@nankai.edu.cn
  • show less
    DOI: 10.1364/PRJ.497947 Cite this Article Set citation alerts
    Yuqi Zhang, Qiang Luo, Dahuai Zheng, Shuolin Wang, Shiguo Liu, Hongde Liu, Fang Bo, Yongfa Kong, Jingjun Xu, "Highly efficient on-chip erbium–ytterbium co-doped lithium niobate waveguide amplifiers," Photonics Res. 11, 1733 (2023) Copy Citation Text show less
    Schematic of the fabrication process for Er3+/Yb3+ co-doped LNOI waveguides.
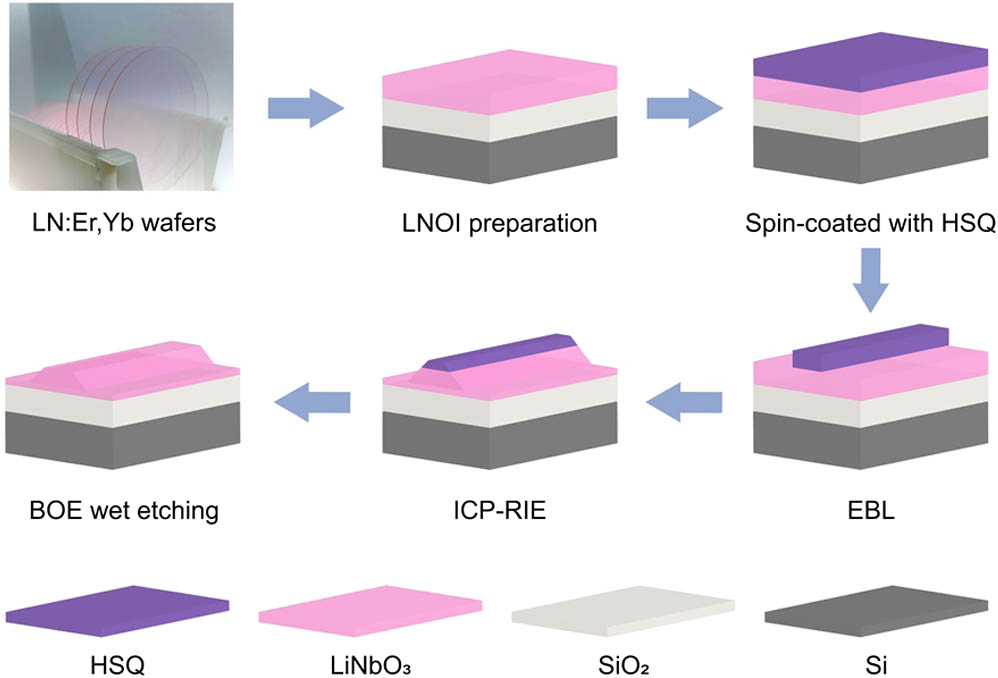
    Fig. 1. Schematic of the fabrication process for Er3+/Yb3+ co-doped LNOI waveguides.
    SEM images of the (a) cross section and (b) longitudinal section of Er3+/Yb3+ co-doped LN waveguide. Simulated electric field distribution of single mode in the LN waveguide at (c) λ=974 nm and (d) λ=1531 nm.
    Fig. 2. SEM images of the (a) cross section and (b) longitudinal section of Er3+/Yb3+ co-doped LN waveguide. Simulated electric field distribution of single mode in the LN waveguide at (c) λ=974  nm and (d) λ=1531  nm.
    Schematic of the experimental setup for characterization of Er3+/Yb3+ co-doped LNOI waveguide amplifiers.
    Fig. 3. Schematic of the experimental setup for characterization of Er3+/Yb3+ co-doped LNOI waveguide amplifiers.
    Optical transmission spectra of Er3+/Yb3+ co-doped LNOI microring resonators on the same chip in (a) 980 nm band and (b) 1550 nm band. The Lorentz fit (red line) shows 2.03×10⁵ and 1.43×10⁵ loaded quality factors near 974 and 1531 nm, respectively. (The inset shows the SEM image of a microring resonator with a radius of 100 μm used for testing in the 1550 nm band.)
    Fig. 4. Optical transmission spectra of Er3+/Yb3+ co-doped LNOI microring resonators on the same chip in (a) 980 nm band and (b) 1550 nm band. The Lorentz fit (red line) shows 2.03×10⁵ and 1.43×10⁵ loaded quality factors near 974 and 1531 nm, respectively. (The inset shows the SEM image of a microring resonator with a radius of 100 μm used for testing in the 1550 nm band.)
    (a) Measured signal spectra at ∼1531.31 nm with increasing pump powers of 0, 0.21, 0.46, 2.96, and 6.20 mW. (b) Dependence of net internal gain on pump power at a fixed on-chip input signal power of ∼28 nW. (c) Net internal gain as a function of increasing signal power at a fixed pump power of ∼6.20 mW. (d) The measured internal conversion efficiency (purple dot) is used as a function of signal power. The red dashed line shows a linear trend based on small signal gain.
    Fig. 5. (a) Measured signal spectra at 1531.31  nm with increasing pump powers of 0, 0.21, 0.46, 2.96, and 6.20 mW. (b) Dependence of net internal gain on pump power at a fixed on-chip input signal power of 28  nW. (c) Net internal gain as a function of increasing signal power at a fixed pump power of 6.20  mW. (d) The measured internal conversion efficiency (purple dot) is used as a function of signal power. The red dashed line shows a linear trend based on small signal gain.
    (a) Infrared absorption spectra of Er3+/Yb3+ co-doped, Er3+ doped, and Yb3+ doped LN. (b) Infrared emission spectra of Er3+/Yb3+ co-doped, Er3+ doped, and Yb3+ doped LN under 980 nm excitation at high pump power. The inset shows the infrared emission spectra of Er3+/Yb3+ co-doped and Er3+ doped LN at lower pump power. (c) Decay curves of the Yb3+ emission at 1062 nm in Er3+/Yb3+ co-doped and Yb3+ doped LN, excited under 980 nm. (d) Decay curves of the Er3+ emission at 1531 nm in Er3+/Yb3+ co-doped and Er3+ doped LN, excited under 980 nm.
    Fig. 6. (a) Infrared absorption spectra of Er3+/Yb3+ co-doped, Er3+ doped, and Yb3+ doped LN. (b) Infrared emission spectra of Er3+/Yb3+ co-doped, Er3+ doped, and Yb3+ doped LN under 980 nm excitation at high pump power. The inset shows the infrared emission spectra of Er3+/Yb3+ co-doped and Er3+ doped LN at lower pump power. (c) Decay curves of the Yb3+ emission at 1062 nm in Er3+/Yb3+ co-doped and Yb3+ doped LN, excited under 980 nm. (d) Decay curves of the Er3+ emission at 1531 nm in Er3+/Yb3+ co-doped and Er3+ doped LN, excited under 980 nm.
    Yuqi Zhang, Qiang Luo, Dahuai Zheng, Shuolin Wang, Shiguo Liu, Hongde Liu, Fang Bo, Yongfa Kong, Jingjun Xu, "Highly efficient on-chip erbium–ytterbium co-doped lithium niobate waveguide amplifiers," Photonics Res. 11, 1733 (2023)
    Download Citation