• Laser & Optoelectronics Progress
  • Vol. 59, Issue 17, 1706006 (2022)
Bin Yang1, Qingchao Zhao2、*, Chuanrui Che1, Baixin An1, Faxiang Zhang2, Wei Sun1, Xin Wang1, Shaodong Jiang2, and Ziwen Xu2
Author Affiliations
  • 1Sinopec Shengli Oilfield Company, Dongying 257000, Shandong , China
  • 2Laser Institute, Qilu University of Technology (Shandong Academy of Sciences), Jinan 250014, Shandong , China
  • show less
    DOI: 10.3788/LOP202259.1706006 Cite this Article Set citation alerts
    Bin Yang, Qingchao Zhao, Chuanrui Che, Baixin An, Faxiang Zhang, Wei Sun, Xin Wang, Shaodong Jiang, Ziwen Xu. High-Precision Optical Fiber Temperature and Pressure Sensor and Its Application in Production Wells[J]. Laser & Optoelectronics Progress, 2022, 59(17): 1706006 Copy Citation Text show less
    Structure of pressure and temperature sensors. (a) Schematic diagram; (b) physical map
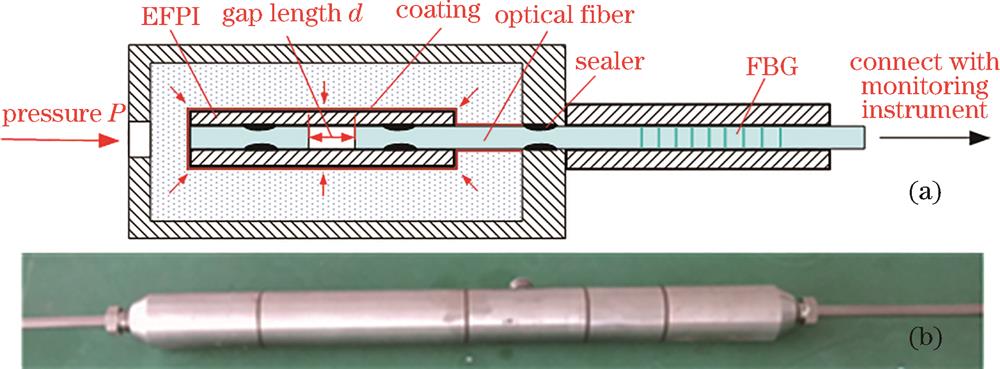
    Fig. 1. Structure of pressure and temperature sensors. (a) Schematic diagram; (b) physical map
    Relationship between FBG wavelength and temperature
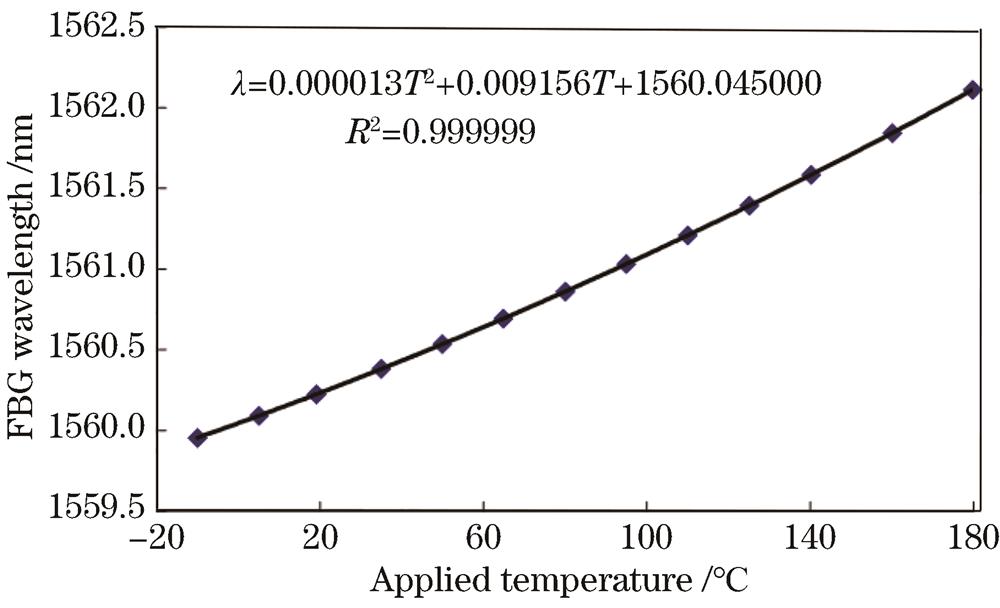
    Fig. 2. Relationship between FBG wavelength and temperature
    Pressure calibration results of the sensor
    Fig. 3. Pressure calibration results of the sensor
    Relationship between pressure sensitivity and temperature
    Fig. 4. Relationship between pressure sensitivity and temperature
    Relationship between EFPI cavity length and temperature under normal pressure
    Fig. 5. Relationship between EFPI cavity length and temperature under normal pressure
    Principle of the downhole monitoring system
    Fig. 6. Principle of the downhole monitoring system
    Principle of monitoring instrument and spectrum of sensor
    Fig. 7. Principle of monitoring instrument and spectrum of sensor
    Test results of cavity length resolution
    Fig. 8. Test results of cavity length resolution
    Long-term online test results in downhole
    Fig. 9. Long-term online test results in downhole
    Test results of shut-in operation
    Fig. 10. Test results of shut-in operation
    Short-term pressure monitoring results with high resolution
    Fig. 11. Short-term pressure monitoring results with high resolution
    PMeasurements (150 ℃)Measurements(23 ℃)Maximum error
    0.1-0.1030.110-0.1090.1030.010
    21.9951.9981.9862.0030.014
    1212.00212.00311.99012.0170.017
    2222.00822.01422.01322.0230.023
    3232.00532.01431.98732.0230.023
    4241.99241.99442.00342.0060.008
    Table 1. Pressure data measured by sensor
    Bin Yang, Qingchao Zhao, Chuanrui Che, Baixin An, Faxiang Zhang, Wei Sun, Xin Wang, Shaodong Jiang, Ziwen Xu. High-Precision Optical Fiber Temperature and Pressure Sensor and Its Application in Production Wells[J]. Laser & Optoelectronics Progress, 2022, 59(17): 1706006
    Download Citation