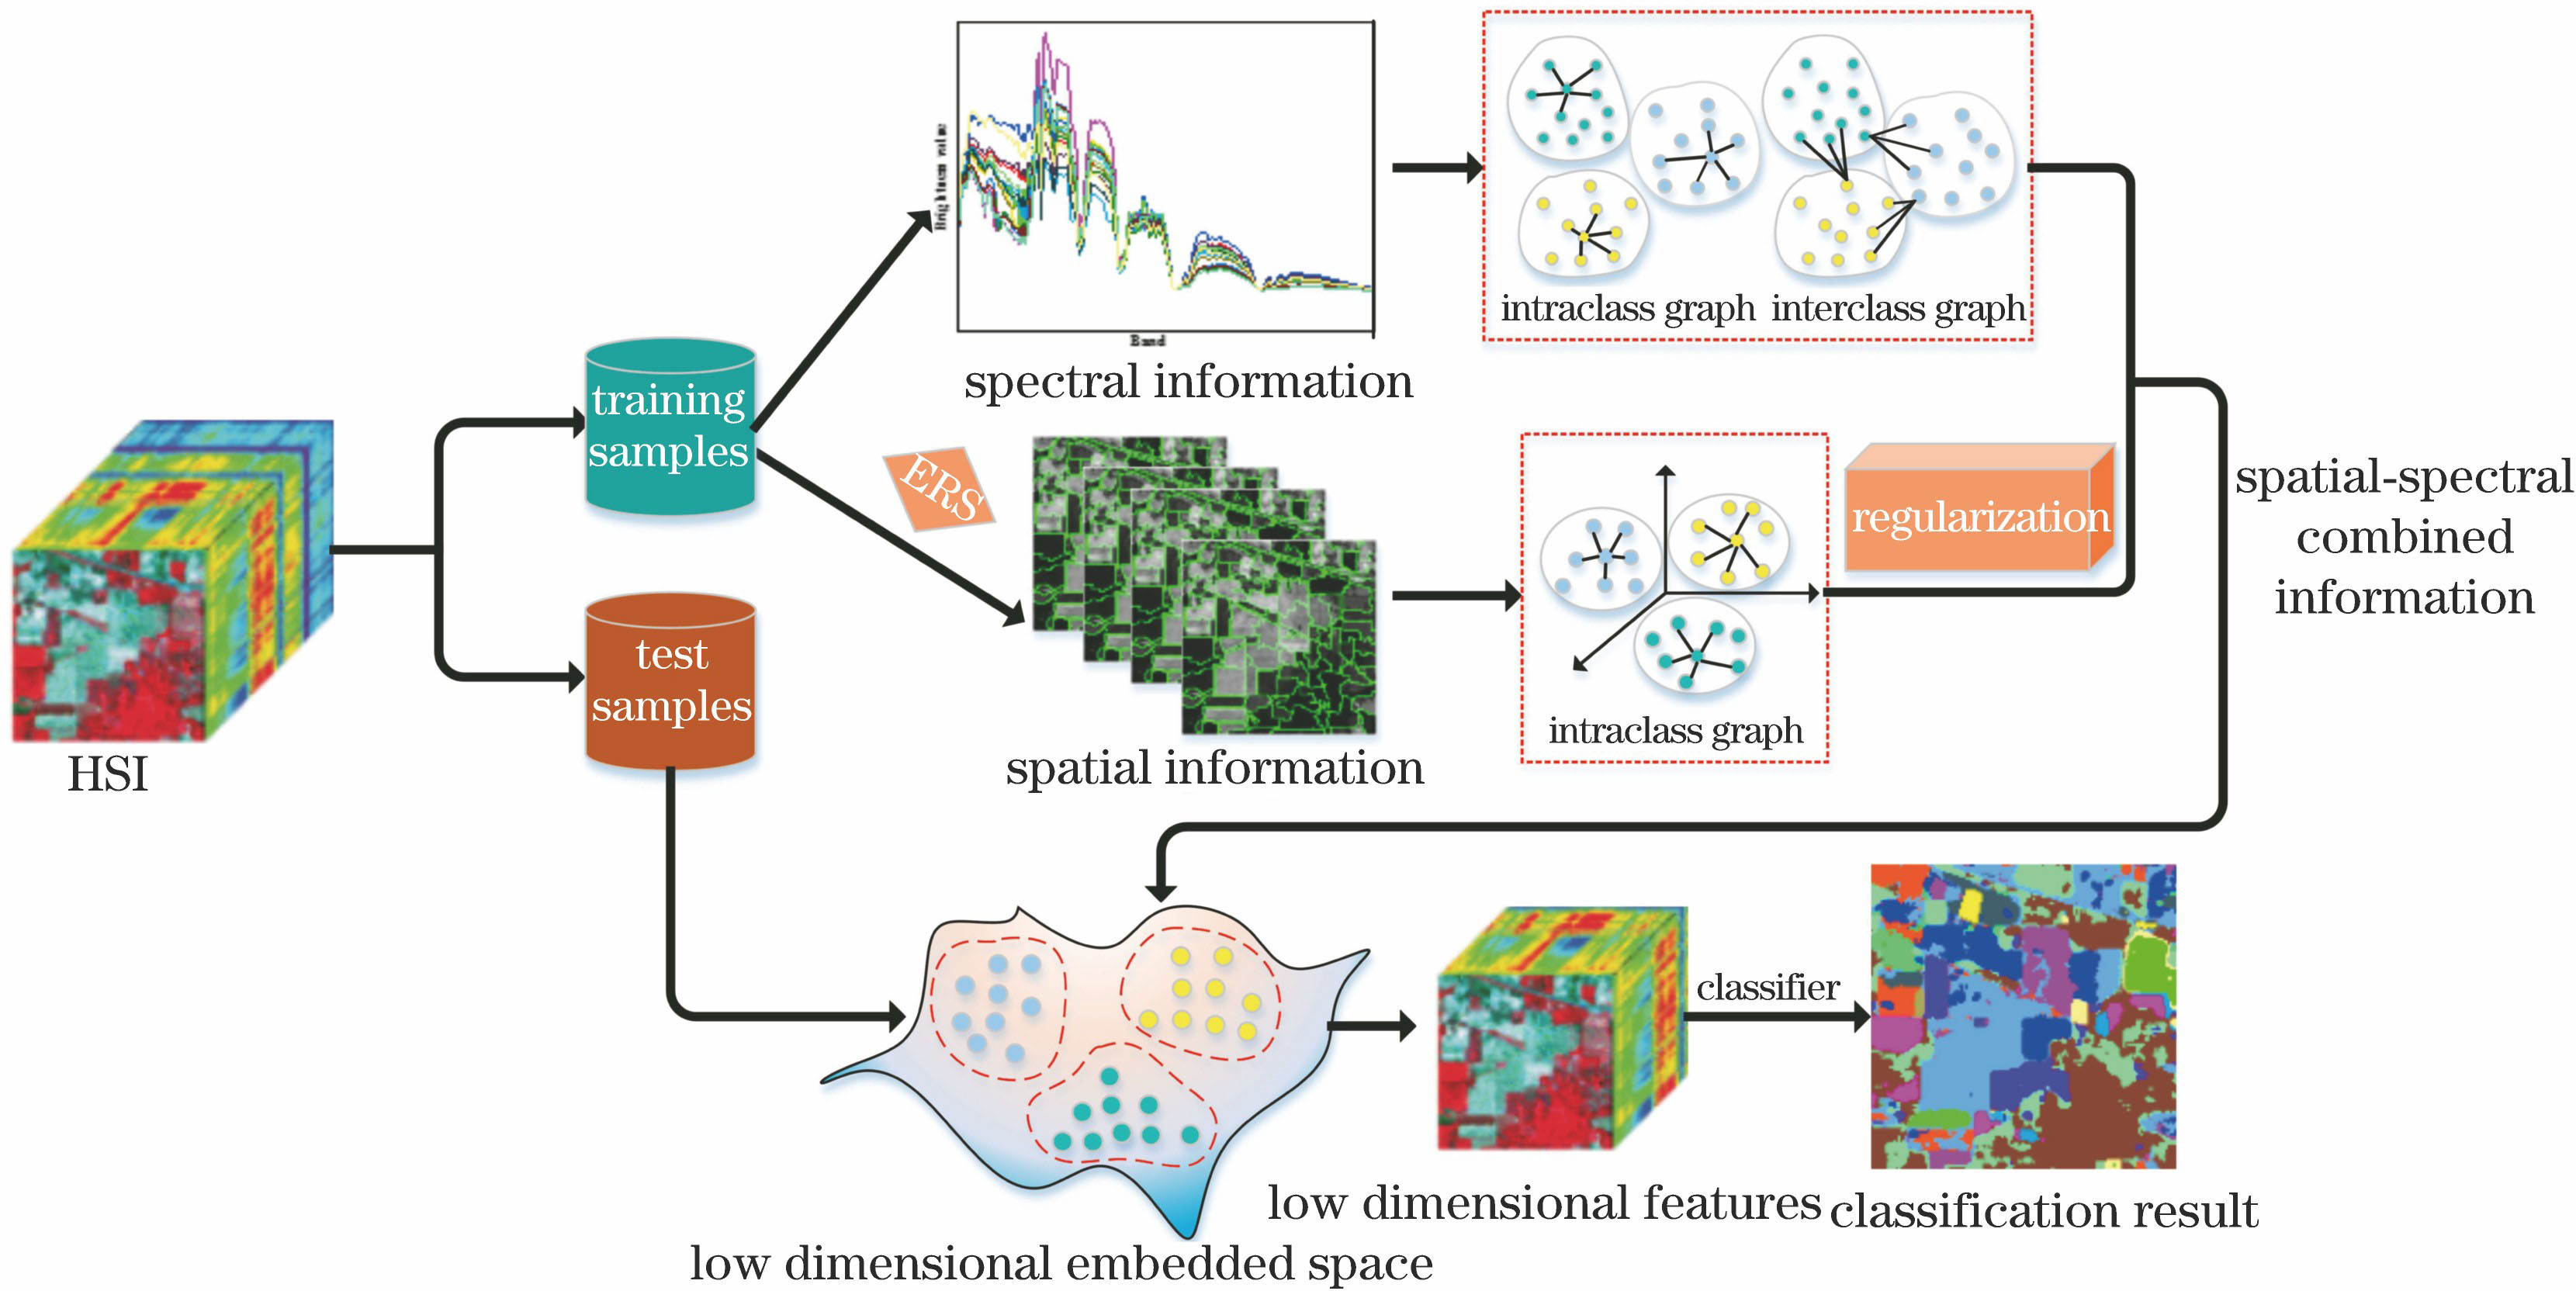
Fig. 1. Flow chart of SSRMDA algorithm
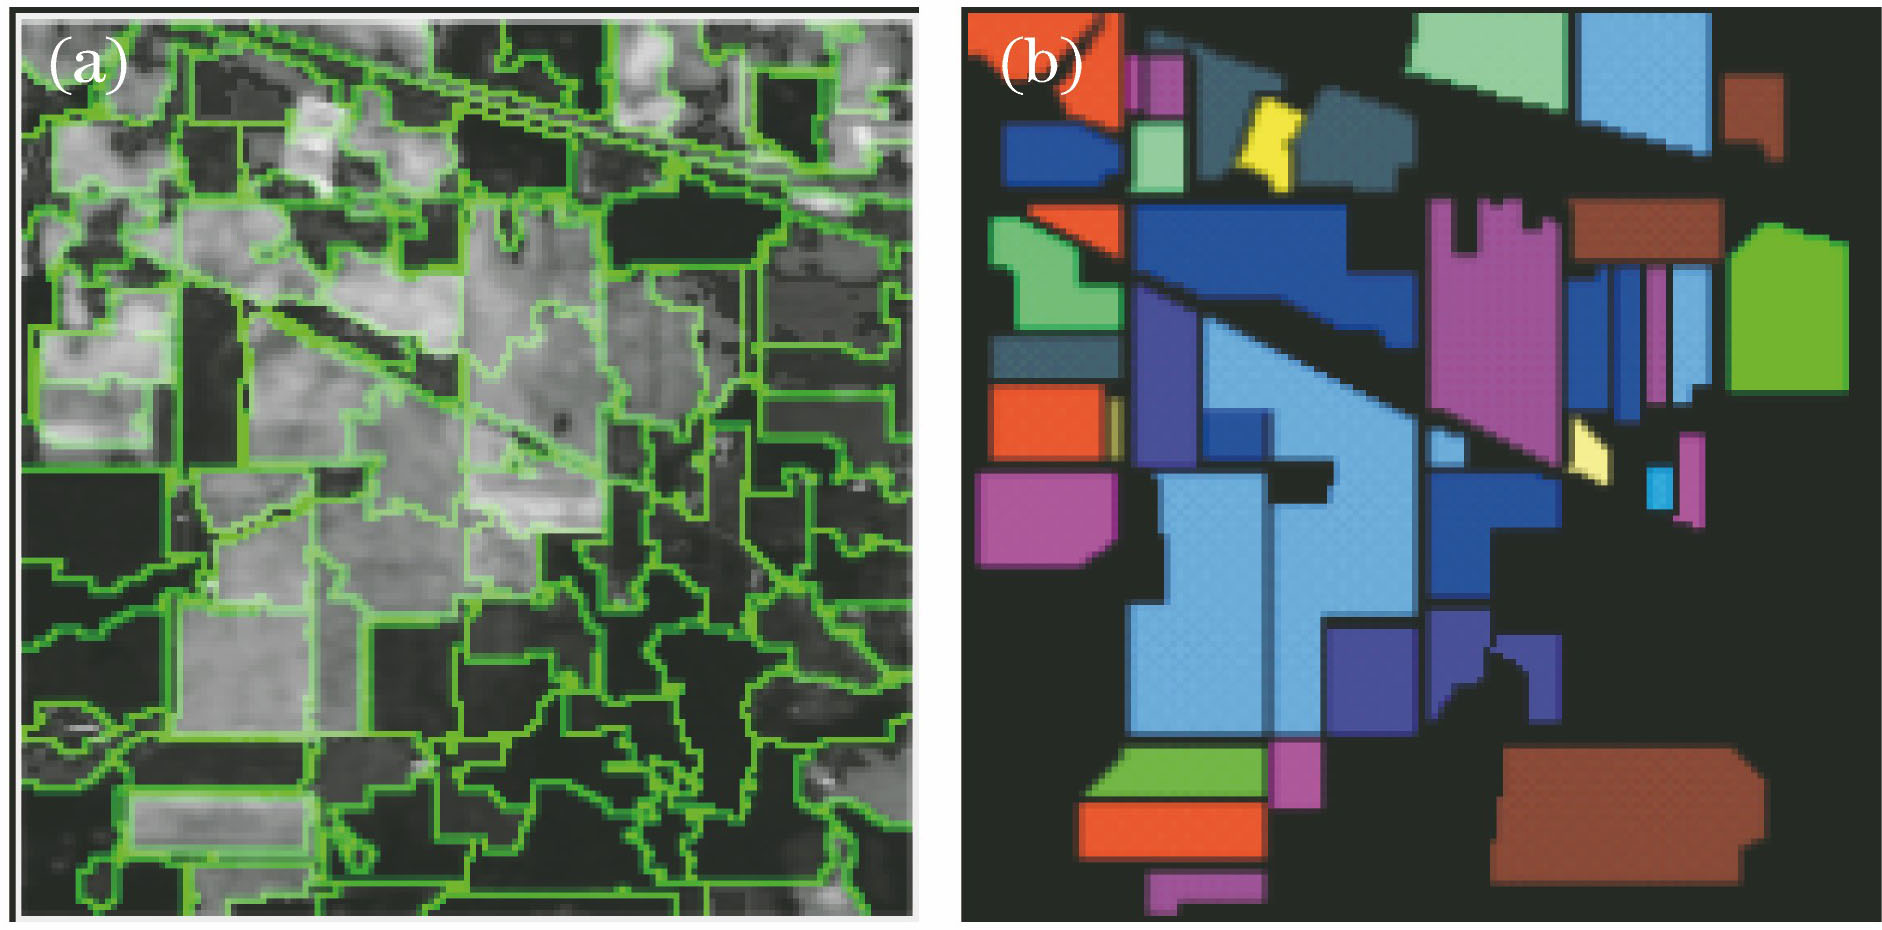
Fig. 2. ERS segmentation and ground-truth images. (a) ERS segmentation image; (b) ground-truth image
Fig. 3. Hyperspectral images in Indian Pines dataset. (a) False-color image; (b) ground-truth image
Fig. 4. Hyperspectral images in Washington DC Mall dataset. (a) False-color image; (b) ground-truth image
Fig. 5. Overall classification accuracy of SSRMDA algorithm with different values of K and Kb on different datasets. (a) Indian Pines dataset; (b) Washington DC Mall dataset
Fig. 6. Overall classification accuracy of SSRMDA algorithm with different α values
Fig. 7. Classification diagrams of different algorithms on Indian Pines dataset
Fig. 8. Classification diagrams of different algorithms on Washington DC Mall dataset
| Algorithm | ni=5 | ni=10 | ni=15 | ni=20 | ni=30 |
|---|
| RAW | 51.81±2.37(0.463) | 59.48±1.72(0.547) | 65.43±1.39(0.613) | 68.45±1.03(0.645) | 71.72±1.04(0.681) | | PCA | 51.73±2.39(0.462) | 59.30±1.71(0.545) | 65.17±1.36(0.610) | 68.22±0.98(0.643) | 71.42±1.05(0.678) | | NPE | 50.17±2.32(0.445) | 56.65±1.81(0.516) | 61.86±1.67(0.574) | 64.78±1.35(0.605) | 67.02±1.24(0.629) | | LPP | 52.08±2.09(0.467) | 59.47±1.80(0.547) | 64.87±1.68(0.607) | 67.13±1.35(0.631) | 70.10±1.08(0.663) | | LDA | 54.82±2.38(0.498) | 63.71±1.70(0.595) | 69.87±1.55(0.662) | 72.26±1.06(0.688) | 75.12±1.10(0.719) | | MFA | 62.10±3.79(0.577) | 74.82±2.03(0.716) | 80.05±1.35(0.775) | 82.99±1.20(0.807) | 86.51±1.09(0.846) | | LGSFA | 60.80±4.10(0.563) | 72.56±1.94(0.691) | 80.38±1.62(0.778) | 83.71±0.99(0.815) | 88.05±1.20(0.864) | | DSSM | 54.15±3.30(0.490) | 62.63±2.95(0.582) | 72.08±1.51(0.686) | 74.44±1.23(0.712) | 76.91±1.17(0.739) | | LPNPE | 56.81±3.37(0.522) | 70.14±2.27(0.666) | 76.89±1.60(0.740) | 81.97±1.55(0.796) | 88.26±0.94(0.866) | | SSRLDE | 56.85±3.19(0.523) | 71.38±2.80(0.680) | 78.97±2.64(0.763) | 83.34±1.97(0.812) | 89.46±0.99(0.880) | | SSRMDA | 70.80±2.87(0.672) | 82.14±2.65(0.798) | 86.22±1.82(0.844) | 89.21±1.51(0.876) | 91.58±1.34(0.904) |
|
Table 1. Classification accuracy of different algorithms on Indian Pines dataset (number before ± indicates overall classification accuracy, and the unit is %; number after ± indicates standard deviation of ov
| Class | RAW | PCA | NPE | LPP | LDA | MFA | LGSFA | DSSM | LPNPE | SSRLDE | SSRMDA |
|---|
| Alfalfa | 97.22 | 97.22 | 97.22 | 97.22 | 100 | 100 | 100 | 97.22 | 100 | 100 | 100 | | Corn-Notill | 61.33 | 61.11 | 55.82 | 60.25 | 69.26 | 83.56 | 82.63 | 59.11 | 76.55 | 79.63 | 86.92 | | Corn-mintill | 58.55 | 58.55 | 52.89 | 54.73 | 67.52 | 75.89 | 76.99 | 56.58 | 76.26 | 77.61 | 89.54 | | Corn | 53.30 | 53.74 | 43.61 | 48.01 | 67.84 | 92.07 | 93.83 | 44.05 | 85.90 | 90.31 | 88.99 | | Grass-pasture | 71.46 | 71.24 | 63.63 | 67.44 | 83.51 | 89.21 | 89.43 | 73.57 | 89.21 | 89.85 | 91.12 | | Grass-trees | 90.49 | 90.35 | 85.17 | 82.51 | 97.90 | 99.44 | 99.58 | 93.98 | 82.93 | 79.86 | 99.58 | | Grassp-asture-mowed | 100 | 100 | 100 | 100 | 100 | 100 | 100 | 100 | 100 | 100 | 100 | | Hay-windrowed | 87.82 | 87.82 | 77.35 | 81.19 | 71.58 | 97.43 | 97.65 | 88.03 | 92.52 | 98.50 | 97.43 | | Oats | 100 | 100 | 100 | 100 | 100 | 100 | 100 | 100 | 100 | 100 | 100 | | Soybean-nottill | 77.54 | 76.81 | 69.04 | 70.62 | 75.34 | 89.08 | 85.41 | 80.06 | 84.89 | 86.46 | 86.25 | | Soybean-mintill | 74.93 | 74.73 | 68.70 | 70.15 | 73.73 | 83.41 | 85.82 | 72.19 | 81.21 | 83.41 | 92.02 | | Soybean-clean | 47.33 | 46.64 | 43.71 | 46.12 | 46.47 | 86.23 | 78.31 | 43.37 | 71.77 | 83.821 | 90.88 | | Wheat | 96.92 | 96.92 | 96.92 | 97.94 | 97.94 | 98.97 | 98.97 | 96.92 | 98.46 | 98.97 | 98.97 | | Woods | 76.53 | 76.21 | 73.95 | 75.56 | 78.30 | 82.90 | 84.27 | 76.53 | 84.19 | 85.80 | 85.08 | | Buildings-Grass-Trees-Drives | 71.01 | 71.27 | 68.88 | 69.15 | 76.59 | 85.63 | 84.84 | 72.87 | 91.49 | 88.03 | 86.97 | | Stone-Steel-Towers | 100 | 100 | 97.59 | 100 | 100 | 100 | 100 | 98.79 | 100 | 100 | 100 | | OA | 72.24 | 72.01 | 66.61 | 68.54 | 74.66 | 86.37 | 86.31 | 71.33 | 82.46 | 84.66 | 90.37 | | AA | 79.03 | 78.91 | 74.65 | 76.31 | 81.62 | 91.49 | 91.11 | 78.33 | 88.46 | 90.14 | 93.36 | | Kappa | 0.684 | 0.682 | 0.620 | 0.642 | 0.712 | 0.845 | 0.844 | 0.674 | 0.800 | 0.826 | 0.890 |
|
Table 2. Classification accuracy of each-class grand object on Indian Pines dataset obtained by different algorithms%
| Algorithm | ni=5 | ni=10 | ni=15 | ni=20 | ni=30 |
|---|
| RAW | 80.86±2.96(0.761) | 82.80±2.23(0.786) | 84.07±2.17(0.802) | 85.87±1.86(0.824) | 86.60±1.22(0.833) | | PCA | 80.86±2.96(0.761) | 82.79±2.23(0.786) | 84.06±2.18(0.802) | 85.86±1.86(0.824) | 86.58±1.23(0.833) | | NPE | 79.91±3.33(0.750) | 81.20±3.06(0.767) | 82.91±2.13(0.788) | 84.94±1.74(0.812) | 85.28±1.67(0.817) | | LPP | 80.21±3.35(0.753) | 82.24±1.91(0.779) | 83.47±1.87(0.795) | 85.46±1.81(0.819) | 86.39±1.72(0.831) | | LDA | 81.56±3.33(0.770) | 83.08±2.23(0.790) | 85.52±1.77(0.820) | 86.69±1.48(0.834) | 87.84±1.27(0.848) | | MFA | 84.49±2.51(0.806) | 87.92±2.25(0.849) | 90.98±2.20(0.887) | 91.87±0.89(0.898) | 92.70±0.59(0.908) | | LGSFA | 85.48±2.68(0.818) | 88.53±2.20(0.857) | 91.28±1.15(0.891) | 92.47±1.03(0.906) | 93.64±0.98(0.920) | | DSSM | 80.63±3.31(0.759) | 82.80±2.19(0.786) | 84.08±2.57(0.802) | 85.33±2.11(0.817) | 86.61±1.22(0.833) | | LPNPE | 78.71±5.15(0.736) | 86.65±2.63(0.834) | 87.75±2.36(0.847) | 89.14±1.02(0.864) | 90.34±1.06(0.879) | | SSRLDE | 79.45±5.36(0.744) | 86.51±4.22(0.832) | 87.34±3.30(0.843) | 89.62±1.37(0.870) | 90.86±1.19(0.886) | | SSRMDA | 88.73±2.15(0.859) | 92.78±1.19(0.910) | 94.04±0.98(0.925) | 95.35±0.73(0.942) | 96.67±0.73(0.958) |
|
Table 3. Classification accuracy of different algorithms on Washington DC Mall dataset (number before ± indicates overall classification accuracy, and the unit is %; number after ± indicates standard deviation
| Class | RAW | PCA | NPE | LPP | LDA | MFA | LGSFA | DSSM | LPNPE | SSRLDE | SSRMDA |
|---|
| Road | 95.04 | 95.01 | 94.71 | 94.38 | 94.76 | 97.83 | 98.71 | 95.17 | 93.72 | 95.06 | 99.79 | | Water | 94.12 | 94.12 | 93.57 | 94.74 | 96.33 | 97.24 | 98.22 | 94.13 | 99.26 | 96.45 | 98.39 | | Building | 87.67 | 87.64 | 86.56 | 86.53 | 88.33 | 91.40 | 93.15 | 87.64 | 96.93 | 95.39 | 98.61 | | Vegetation | 97.34 | 97.34 | 97.01 | 97.27 | 97.37 | 97.88 | 97.88 | 97.34 | 97.08 | 96.40 | 98.73 | | Trail | 66.83 | 66.89 | 64.04 | 69.39 | 72.35 | 89.52 | 93.20 | 66.66 | 91.86 | 82.38 | 93.76 | | Shadow | 67.90 | 67.90 | 65.03 | 67.73 | 68.20 | 73.78 | 80.46 | 67.86 | 72.85 | 72.05 | 82.66 | | OA | 88.09 | 88.08 | 87.05 | 87.91 | 88.87 | 92.81 | 94.64 | 88.11 | 92.90 | 91.64 | 96.70 | | AA | 84.82 | 84.82 | 83.49 | 85.01 | 86.22 | 91.28 | 93.60 | 84.80 | 91.95 | 89.62 | 95.49 | | Kappa | 0.850 | 0.849 | 0.837 | 0.848 | 0.860 | 0.909 | 0.933 | 0.850 | 0.911 | 0.895 | 0.959 |
|
Table 4. Classification accuracy of each-class ground object on Washington DC Mall dataset obtained by different algorithms%