Author Affiliations
1College of Mechanical Engineering, Jiangnan University, Wuxi, Jiangsu 214122, China2Jiangsu Key Laboratory of Advanced Food Manufacturing Equipment Technology, College of Mechanical Engineering, Jiangnan University, Wuxi, Jiangsu 214122, Chinashow less
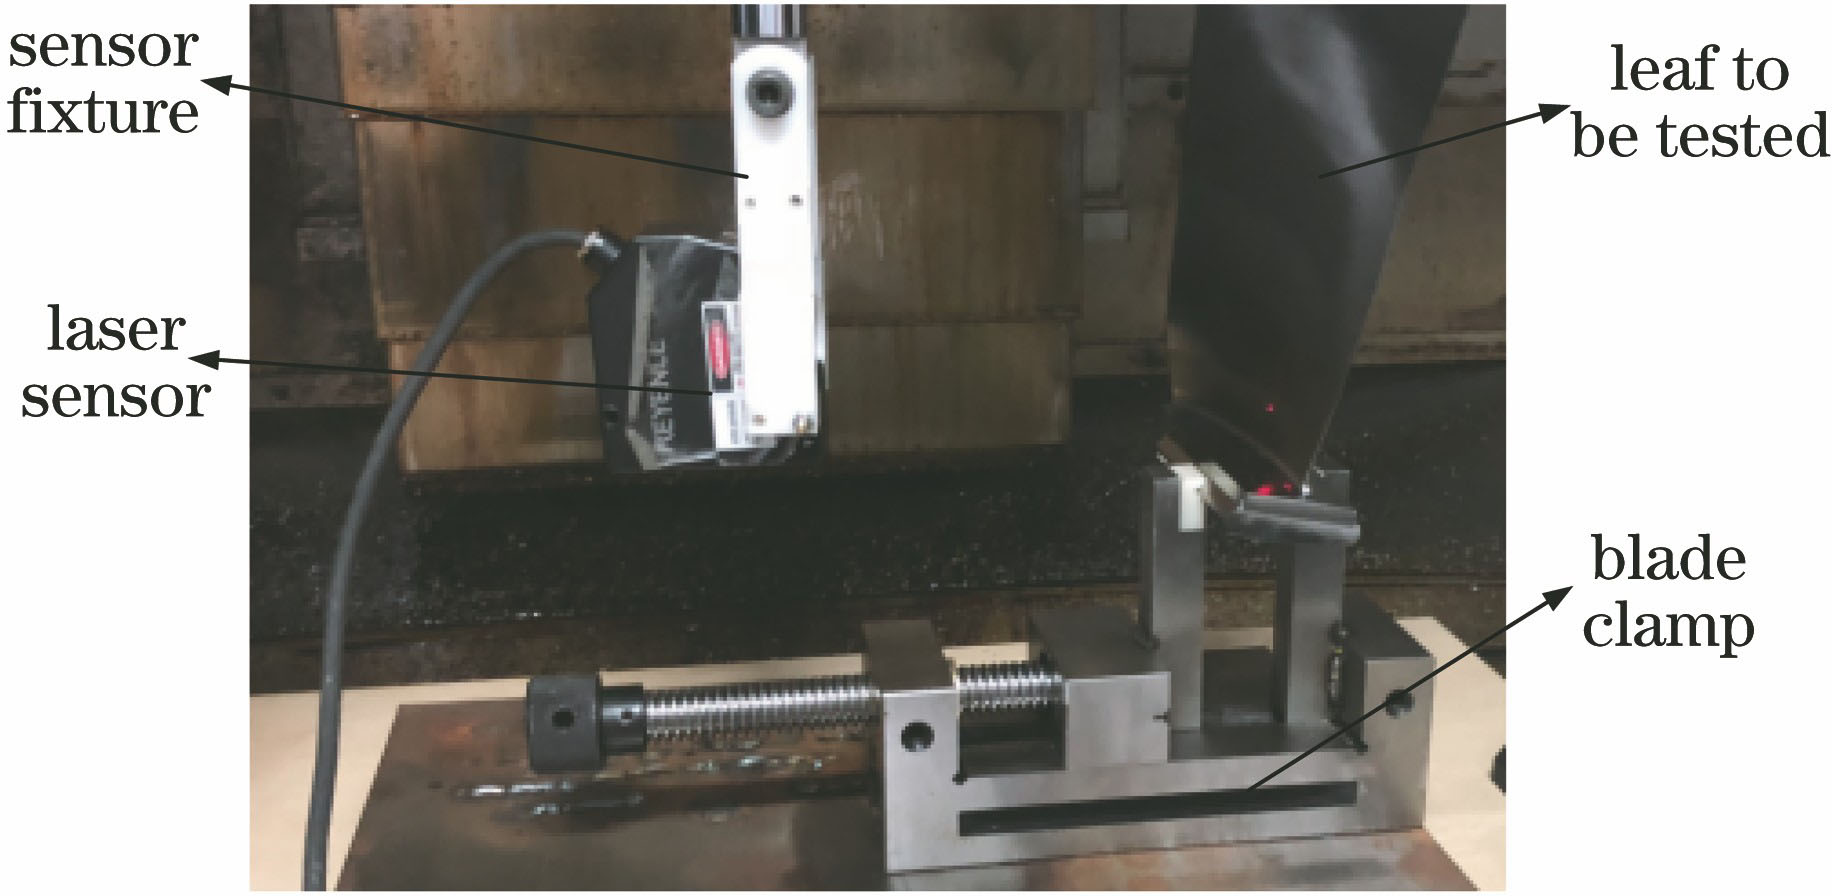
Fig. 1. Laser measurement experiment platform
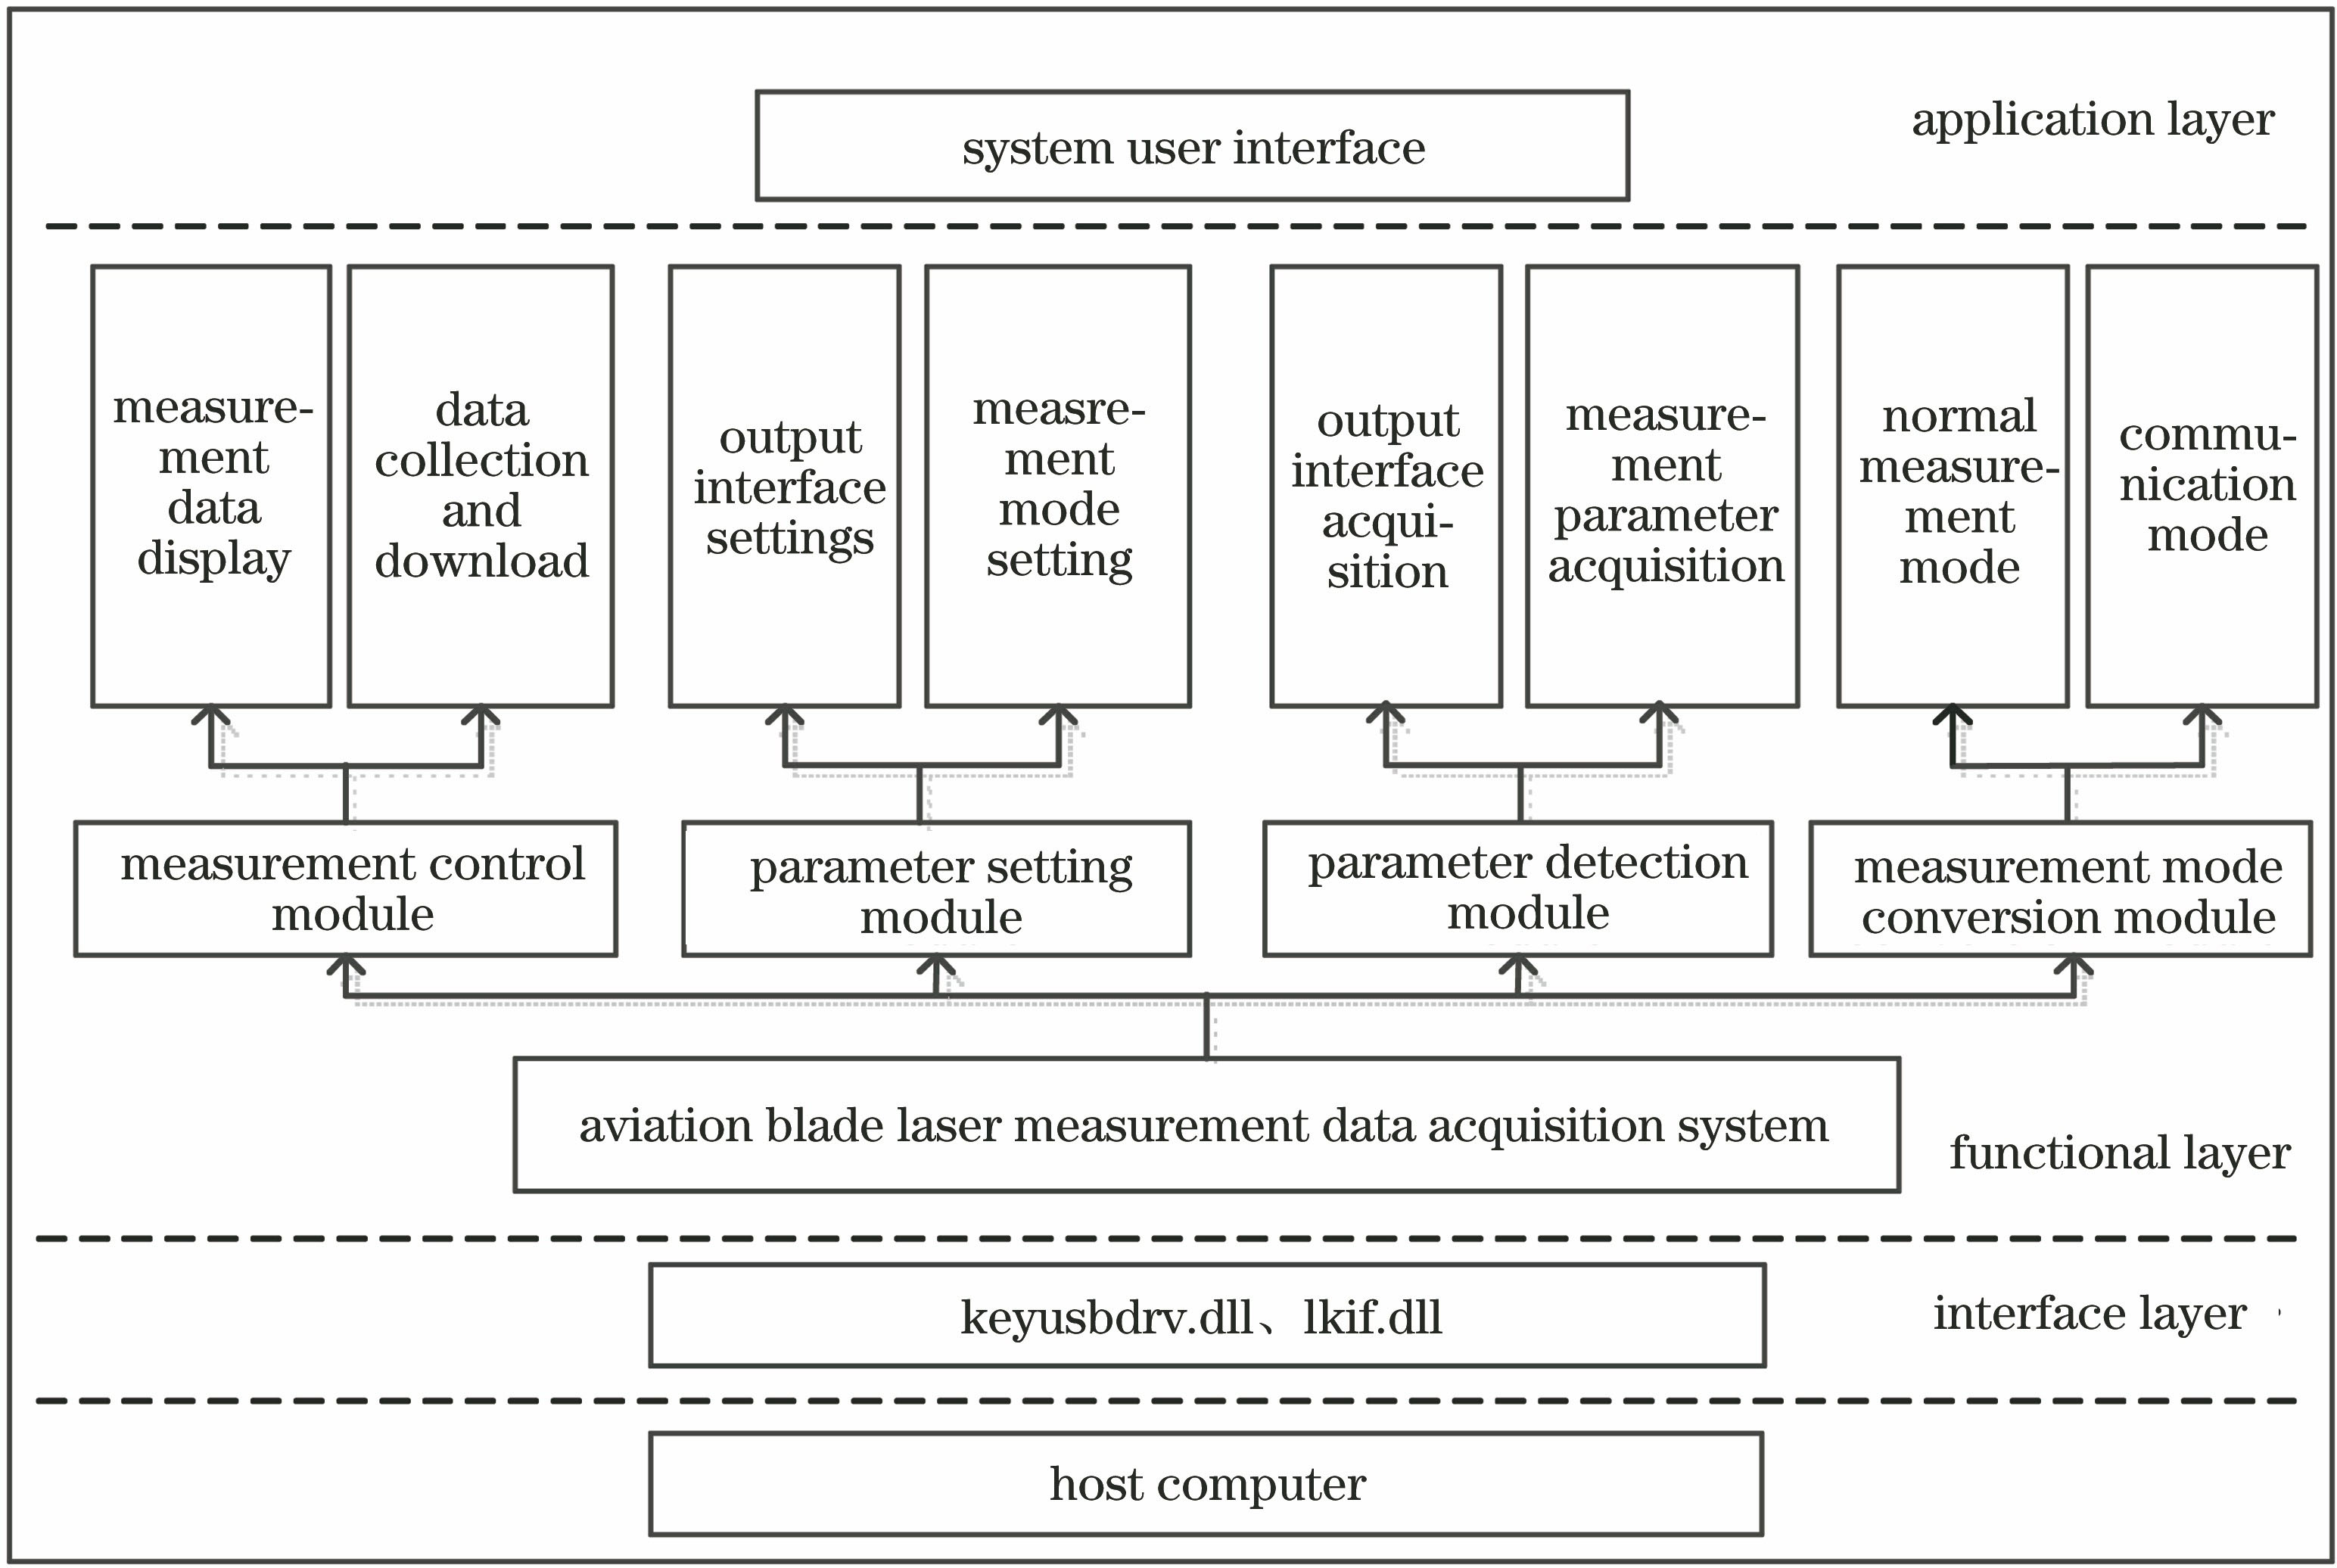
Fig. 2. Functional map of the laser measurement data acquisition system
Fig. 3. String height difference method
Fig. 4. Front view of measuring point cloud data hop processing
Fig. 5. Incident tilt angle error under standard reference distance
Fig. 6. Compensated point cloud data. (a) Leaf back point cloud data; (b) leaf basin point cloud data
Fig. 7. Data compensation effect chart
Fig. 8. Theoretical CAD model outline extraction
Fig. 9. Example of local contour optimization. (a) Example based on the leading edge contour; (b) example based on the trailing edge contour; (c) examples based on front and rear edge contours
| Serialnumber | Measurement /mm | Measuringdistance /mm | Δd /mm | Δx /mm | Inclination /(°) | Compensationvalue /mm | Correctionvalue /mm |
|---|
| 1 | -1.5594 | 148.4406 | 0.3374 | 0.6 | 29.3653 | 0.1208 | -2.3677 | | 2 | -1.2398 | 148.7602 | 0.3501 | 0.6 | 30.2789 | 0.1267 | -2.0362 | | 3 | -0.9341 | 149.0659 | 0.3196 | 0.6 | 28.0569 | 0.1129 | -1.6723 | | … | … | … | … | … | … | … | … | | 70 | 7.8608 | 157.8608 | 0.0095 | 0.88 | 0.6188 | 0.0047 | 7.8560 | | 71 | 7.8513 | 157.8513 | 0.0413 | 0.88 | 2.6883 | 0.0126 | 7.8386 | | 72 | 7.8926 | 157.8926 | 0.0069 | 0.88 | 0.4494 | 0.0040 | 7.8885 | | … | … | … | … | … | … | … | … | | 135 | 6.2546 | 156.2546 | 0.0635 | 0.88 | 4.1293 | 0.0179 | 6.2366 | | 136 | 6.1911 | 156.1911 | 0.0389 | 0.88 | 2.5323 | 0.0121 | 6.1789 | | 137 | 6.1522 | 156.1522 | 0.0928 | 0.88 | 6.0229 | 0.0245 | 6.1276 |
|
Table 1. Aviation blade inclination compensation
| min F(R, T) | θ /(°) | tx /mm | ty /mm |
|---|
| Leading edge | 1398.72 | 0.03709 | 0.56479 | 2.33445 | | R | 0.999312065741549 | 0.0370863217825341 | 0 | | -0.0370863217825341 | 0.999312065741549 | 0 | | 0 | 0 | 1 | | Trailing edge | 162.23461 | 0.01034 | -0.05164 | 0.56403 | | R | 0.999946463239941 | 0.0103474950559580 | 0 | | -0.0103474950559580 | 0.999946463239941 | 0 | | 0 | 0 | 1 | | Front andrear edge | 0.35663 | -3.57906×10⁻⁵ | 0.00311 | 0.00291 | | R | 0.999999999359514 | -3.57906802125446×10⁻⁵ | 0 | | 3.57906802125446×10⁻⁵ | 0.999999999359514 | 0 | | 0 | 0 | 1 | | Front and rearedge, leaf back | 0.41309 | -1.60869×10⁻⁴ | 0.01215 | -0.03473 | | R | 0.999999987060500 | -1.60869511642089×10⁻⁴ | 0 | | -1.60869511642089×10⁻⁴ | 0.999999987060500 | 0 | | 0 | 0 | 1 | | Overall | 0.028669 | -8.10865×10⁻⁵ | 0.00573 | -0.01357 | | R | 0.999999996712489 | 8.10865132359233×10⁻⁵ | 0 | | 8.10865132359233×10⁻⁵ | 0.999999996712489 | 0 | | 0 | 0 | 1 |
|
Table 2. Algorithm examples based on local and global contours
| Optimal matchingprofile | Leadingedge | Leafback | Trailingedge | Leafpot |
|---|
| Leading edge | 0.02289 | 4.27060 | 4.38616 | 4.32165 | | Trailing edge | 1.16271 | 1.18390 | 0.02898 | 1.12234 | | Front andrear edge | 0.02944 | 0.08864 | 0.03235 | 0.05120 | | Front and rearedge, leaf back | 0.05638 | 0.04986 | 0.05923 | 0.08321 | | Overall | 0.0324 | 0.0788 | 0.0362 | 0.0703 |
|
Table 3. Example of optimal contour matching algorithm
| Algorithm | min F(R, T) | Ø /(°) | φ /(°) | θ /(°) | tx /mm | ty /mm | tz /mm |
|---|
| Algorithmbeforeimprovement | 1 | 0.34999 | -0.00269 | -0.00006 | -0.00008 | -0.20599 | -1.00174 | 0.00433 | | 2 | 0.30949 | -0.00168 | -0.00029 | 0.00008 | -0.10075 | -0.63260 | 0.00297 | | R | | 0.999999823633103 | -8.1951572453×10⁻⁵ | 5.88232694803×10⁻⁴ | | 8.3531918857×10⁻⁵ | 0.999996386307458 | 0.002687079165782 | | 5.88010358748×10⁻⁴ | -0.00268712782807 | 0.999996216786770 | | Improvedalgorithm | 1 | 0.31707 | -0.00195 | -0.00037 | 0.00005 | -0.13089 | -0.03159 | 0.00390 | | 2 | 0.28738 | 0.00029 | 0.00009 | 0.00007 | 0.04131 | -0.06538 | 0.00061 | | R | | 0.999999993484091 | -6.739084572×10⁻⁵ | -9.2142784317×10⁻⁵ | | 6.7417921103×10⁻⁵ | 0.999999954547624 | -2.93869993549×10⁻⁴ | | -9.2122975981×10⁻⁵ | 2.93876203709×10⁻⁴ | 0.999999952575066 |
|
Table 4. Results comparison of motion parameters before and after improved particle swarm optimization